
(T2108 measures the percentage of stocks trading above their respective 40-day moving averages [DMAs]. It helps to identify extremes in market sentiment that are likely to reverse. To learn more about it, see my T2108 Resource Page. You can follow real-time T2108 commentary on twitter using the #T2108 hashtag. T2108-related trades and other trades are occasionally posted on twitter using the #120trade hashtag. T2107 measures the percentage of stocks trading above their respective 200DMAs)
T2108 Status: 36.2%
T2107 Status: 29.1%
VIX Status: 15.6 (back to the 15.35 pivot)
General (Short-term) Trading Call: bullish – see below for caveats
Active T2108 periods: Day #7 over 20%, Day #1 over 30% (ending 9 days under 30%) (overperiod), Day #11 under 40%, Day #15 below 50%, Day #30 under 60%, Day #371 under 70%
Reference Charts (click for view of last 6 months from Stockcharts.com):
S&P 500 or SPY
SDS (ProShares UltraShort S&P500)
U.S. Dollar Index (volatility index)
EEM (iShares MSCI Emerging Markets)
VIX (volatility index)
VXX (iPath S&P 500 VIX Short-Term Futures ETN)
EWG (iShares MSCI Germany Index Fund)
CAT (Caterpillar).
IBB (iShares Nasdaq Biotechnology).
Commentary
S&P 500 testing resistance from 50 and 200DMAs. Closed most trades from near oversold conditions: https://t.co/WOeDxqhHYU $SPY
— Dr. Duru (@DrDuru) December 23, 2015
The trades on oversold conditions that I triggered a tad early worked out after a nice three-day bounce on the S&P 500 (SPY).
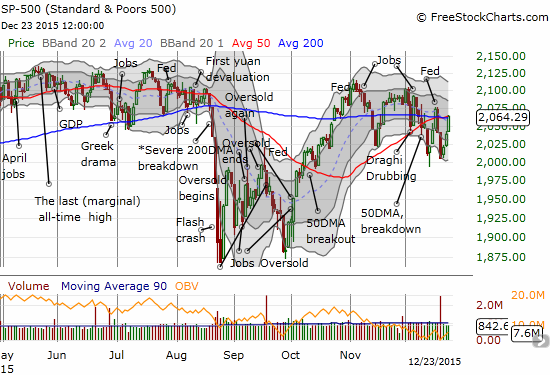
T2108, the percentage of stocks trading above their respective 40DMAs, has soared from the edge of oversold conditions (20.1%) to 36.2%, a 2-week high. This is an interesting contrast and a potential bullish divergence from the S&P 500 (SPY). The index’s rally has not yet erased the big 2-day post-Fed fade from last week which means it is suddenly underperforming relative to T2108. A big tension now exists between this bullish divergence and an index that closed right at critical resistance. On top of this, the volatility index has plunged but sits right at the 15.35 pivot. This pivot has served as a springboard for the last two pops in volatility.
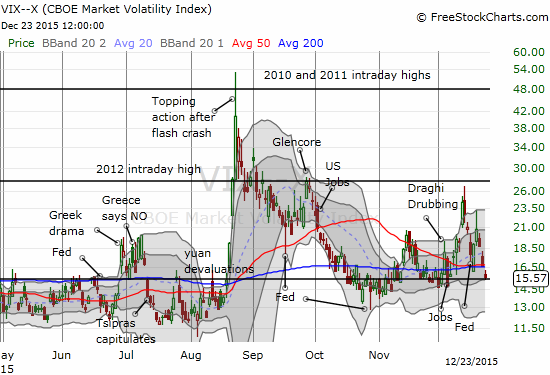
While I sold my ProShares Ultra S&P500 (SSO) call options, I held my put options on ProShares Ultra VIX Short-Term Futures (UVXY). These put options expire at the end of the year, but I will likely lock in the profits on the holiday-shortened Christmas Eve trading session.
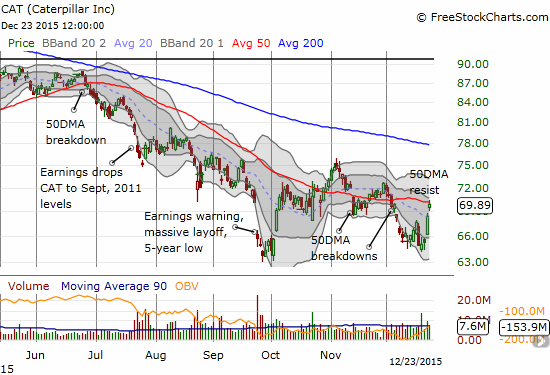
Commodity-related stocks were on fire today. Probably some combination of short-covering and traders chasing some bottom-fishing plays in the face of the plunge of volatility. Leading the charge was Caterpillar (CAT). CAT rushed higher in the morning and was up as much as 3.1% or so before settling for a 2.2% gain. I used this rally to renew my favorite hedge against bullishness and loaded up on a fresh batch of put options. With CAT failing to close above 50DMA resistance, I am on the look-out to add to this bearish position with an outright short on shares on a break of today’s intraday low.
The Santa Claus rally is finally underway with very timely bounce for the S&P 500. T2108 stopped cold right at the edge of oversold trading conditions and once again demonstrated why I treat the oversold barrier as a looser trigger point than I used to in the past. The caveats to bullishness I note above suggest that latecomers to the Santa Claus rally may get one more dip to buy and participate in this remarkably consistent seasonal pattern.
Daily T2108 vs the S&P 500
")
Black line: T2108 (measured on the right); Green line: S&P 500 (for comparative purposes)
Red line: T2108 Overbought (70%); Blue line: T2108 Oversold (20%)
Weekly T2108

*All charts created using freestockcharts.com unless otherwise stated
The charts above are the my LATEST updates independent of the date of this given T2108 post. For my latest T2108 post click here.
Related links:
The T2108 Resource Page
Expanded daily chart of T2108 versus the S&P 500
Expanded weekly chart of T2108
Be careful out there!
Full disclosure: long FXCM, long AAPL call options, long UVXY put option, long SSO call options