
(T2108 measures the percentage of stocks trading above their respective 40-day moving averages [DMAs]. It helps to identify extremes in market sentiment that are likely to reverse. To learn more about it, see my T2108 Resource Page. You can follow real-time T2108 commentary on twitter using the #T2108 hashtag. T2108-related trades and other trades are occasionally posted on twitter using the #120trade hashtag. T2107 measures the percentage of stocks trading above their respective 200DMAs)
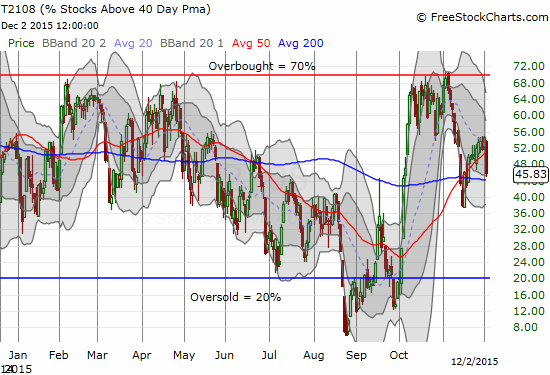
T2108 Status: 45.8%
T2107 Status: 33.6%
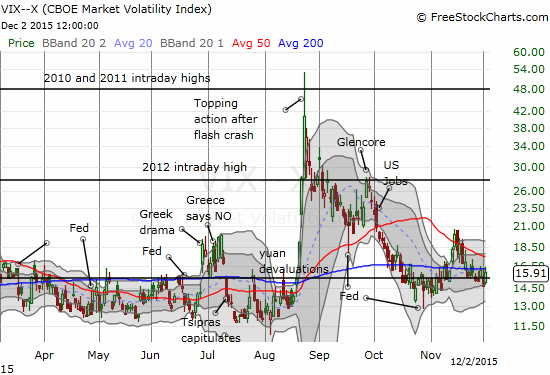
VIX Status: 15.9
General (Short-term) Trading Call: neutral
Active T2108 periods: Day #42 over 20%, Day #41 over 30%, Day #12 over 40% (overperiod), Day #1 below 50% (underperiod), Day #16 under 60%, Day #356 under 70%
Reference Charts (click for view of last 6 months from Stockcharts.com):
S&P 500 or SPY
SDS (ProShares UltraShort S&P500)
U.S. Dollar Index (volatility index)
EEM (iShares MSCI Emerging Markets)
VIX (volatility index)
VXX (iPath S&P 500 VIX Short-Term Futures ETN)
EWG (iShares MSCI Germany Index Fund)
CAT (Caterpillar).
IBB (iShares Nasdaq Biotechnology).
Commentary
In the last T2108 Update, I noted how the market’s strength at the time seemed to run contrary to a host of other bearish signals. That surprising strength continued to start trading for December when the S&P 500 (SPY) launched for a 1.1% gain. The close represented a breakout above a very tight range of churn that held the index in place for 7 trading days. Today, December 2, the S&P 500 perfectly reversed all those gains and brought bearish highlights back into prominence.
First, note in the chart below how all the trading action continues to unfold neatly right on top of the 20-day moving average (DMA).
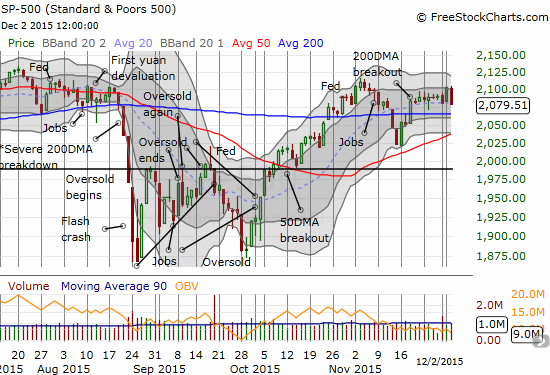
If the S&P 500 had closed below its 20DMA, I would have added a “bearish shade” to my neutral short-term trading call. Still, I am wary. Thanks to my favorite technical indicator, T2108, the percentage of stocks trading above their respective 40DMAs, I know that the past two trading days are not the mirror images they appear to be in the chart of the S&P 500. T2108 barely budged on the index’s 1.1% rally. Today’s 1.1% reversal exacted a HEAVY toll on T2108 as it dropped from 54.7% to 45.8%. In other words, this notable setback signaled poor market breadth. Stocks broadly participated in the selling but NOT in the buying. Such behavior signals the kind of poor breadth that can precede larger sell-offs once buyers tire of the same few select winning/trending stocks.
The volatility index, the VIX, added a bit to the alarm by closing above the 15.35 pivot line. The main trading signal comes when the VIX separates from this pivot line.
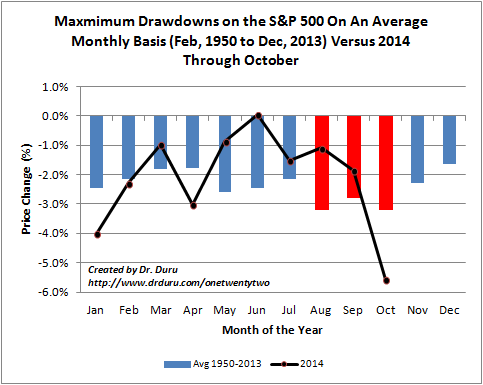
When December jumped to such a roaring start, celebrations seemed in order. I even saw headlines breathlessly speculating on an early start to the seasonal “Santa Claus” rally. The reversal says “not so fast.” However, bears cannot get overly excited either. December tends to be one of the least risky months of the year based on maximum drawdowns. Here is a telling chart from a piece I wrote November, 2014 titled “Still Room For Upside After The S&P 500 Survives Its Most Dangerous Months Of The Year.” December has the LOWEST average maximum drawdown of any month in the year.
The S&P 500 once again survived its most dangerous months of the year. This time the recovery came in rapid order in October. The index is now sitting on a 1.0% year-to-date gain. This year seems to set to defy the January barometer just as I predicted earlier this year. But it will be a close call. There are several important market events coming this month including an OPEC meeting and a likely rate hike from the Federal Reserve which could swing markets wildly. I am expecting profitable trades on BOTH to the upside and the downside before this month settles into the relative calm of the Christmas season. As always, I will take this one step at a time. Let’s see how the market responds to the current setback.
I conclude with one chart: CSX Corporation (CSX), one of America’s major railroads.
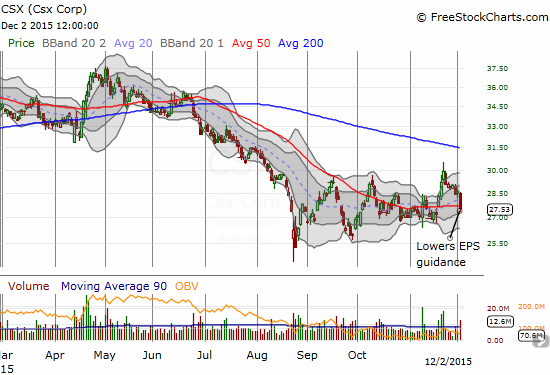
I ended up buying call options as a play on 50DMA support. This was BEFORE I saw what was happening to T2108 on the day…
Daily T2108 vs the S&P 500
")
Black line: T2108 (measured on the right); Green line: S&P 500 (for comparative purposes)
Red line: T2108 Overbought (70%); Blue line: T2108 Oversold (20%)
Weekly T2108

*All charts created using freestockcharts.com unless otherwise stated
The charts above are the my LATEST updates independent of the date of this given T2108 post. For my latest T2108 post click here.
Related links:
The T2108 Resource Page
Expanded daily chart of T2108 versus the S&P 500
Expanded weekly chart of T2108
Be careful out there!
Full disclosure: no positions, long CSX call options
great stats! Hope the market will improve…