
(This is an excerpt from an article I originally published on Seeking Alpha on August 3, 2015. Click here to read the entire piece.)
The rate of homeownership in the U.S. fell a fraction of a percent in the second quarter – from 63.8% in the first quarter to 63.4%. Many headlines rang with alarm. This rate is now the lowest since 1967, so it is easy to convey alarm – even as the current rate is a fraction of a percent below the lows of the 1980s and the 1990s. The chart below shows all the data available through the St. Louis Federal Reserve from the U.S. Census Bureau. Historical data going back to 1965 can be retrieved from the historical tables provided by the U.S. Census Bureau.
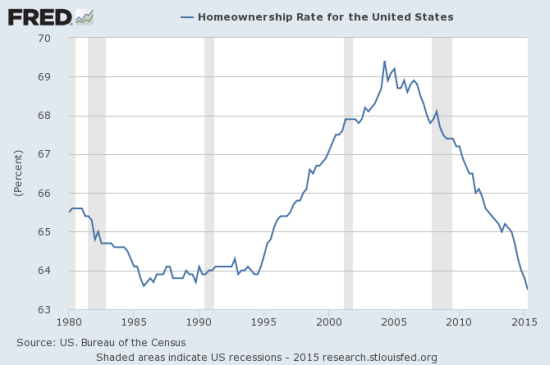
Source: US. Bureau of the Census, Homeownership Rate for the United States [RSAHORUSQ156S], retrieved from FRED, Federal Reserve Bank of St. Louis, July 31, 2015.
{snip}
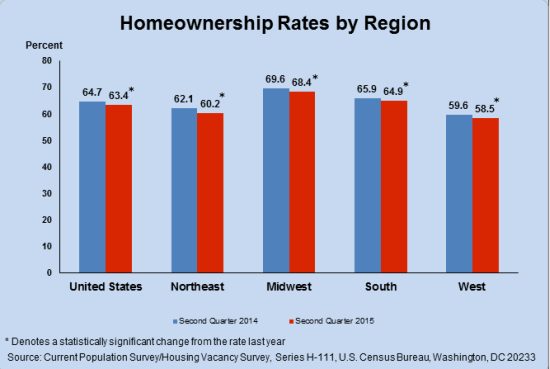
Source: U.S. Census Bureau
Underneath the regional variety, demographics may be the primary driver of today’s changes in the rate of homeownership (and perhaps can even help explain why/how the previous surge in homeownership came at such a heavy economic cost).
{snip}
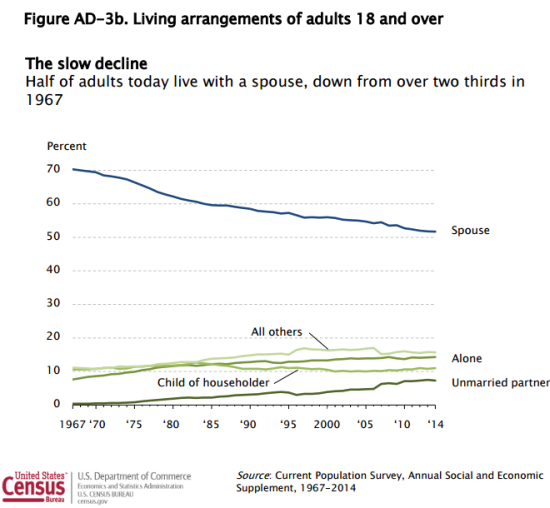
Source: The U.S. Census Bureau
{snip}
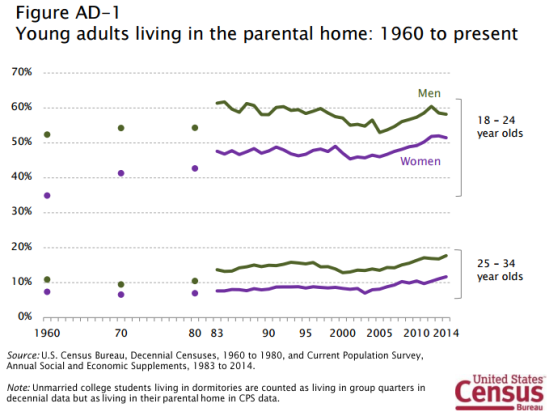
Source: The U.S. Census Bureau
{snip}…it is premature to suggest that a new, long-term trend is underway for all these segments of young adults. If the trends in household formation DO persist, then they could imply on-going delays in spousal living if the phases of adulthood continue the current sequence.
{snip}
Most recently, DR Horton Inc. (DHI) reported strong earnings that included a pick-up in entry-level sales. This encouraging news complements an increase in first-timers in recent existing home sales data. Such news has proved tantalizingly elusive for homebuilders; I even argued earlier that new first-time buyers are not likely to show up in greater number or share this year. The subsequent rally in DHI shares helps demonstrate the potentially strong impact from small, yet positive, changes in the first-time buying demographic discussed above. A fresh reduction in long-term interest rates has also likely helped iShares US Home Construction (ITB) in its latest rise toward 8-year highs.

Source: FreeStockCharts.com
Be careful out there!
Full disclosure: long ITB
(This is an excerpt from an article I originally published on Seeking Alpha on August 3, 2015. Click here to read the entire piece.)