
One big headline on Tuesday, June 23rd featured Facebook (FB) racing past Walmart (WMT) in market capitalization for the first time ever. The following day, FB gained further ground on WMT as the two stocks continued to motor in opposite directions: FB has set new all-time highs two days in a row while WMT hovers above a 2015 low which was a low not seen since October, 2013. WMT has fallen straight down for almost the entire year. At the time of writing FB is worth 249.07B and WMT worth 233.10B.
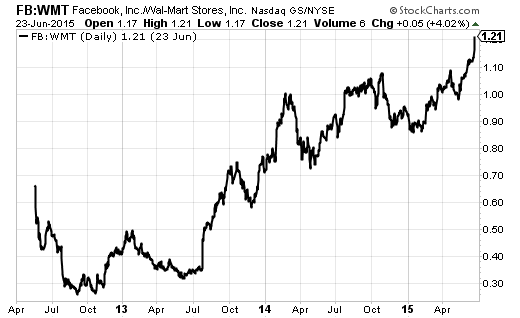
Source: StockCharts.com
Comparing FB to WMT is mainly interesting as an exercise in measuring FB’s ascendancy through the large-cap universe and demonstrating how “new world” continues to overtake “old world” stocks. Even more interesting is compaaring where FB falls in comparison to its contemporaries on the internet. It just so happens that Facebook recently took over the #1 spot in valuation among a select group of internet-related stocks that I watch. Twitter (TWTR) fell from its #1 spot mainly thanks to a major earnings miss in April that sent the stock down 18% in one day. TWTR has continued to drift lower ever since then. Along the way TWTR’s CEO resigned on June 12th and pesky M&A rumors continue to surface about the company. The chart below is a reminder that even after its steep fall, TWTR could be an expensive acquisition.
The chart is sorted from left to right by price-to-sales from lowest to highest. I have taken periodic valuation snapshots over the past three years, and I still show each of those points with different colored bars. The thick black bar represents the latest valuation measurement. This view provides visibility on which companies are on the move relative to sales. I used price-to-sales given some of the companies do not earn a profit.
Click for larger graphic…
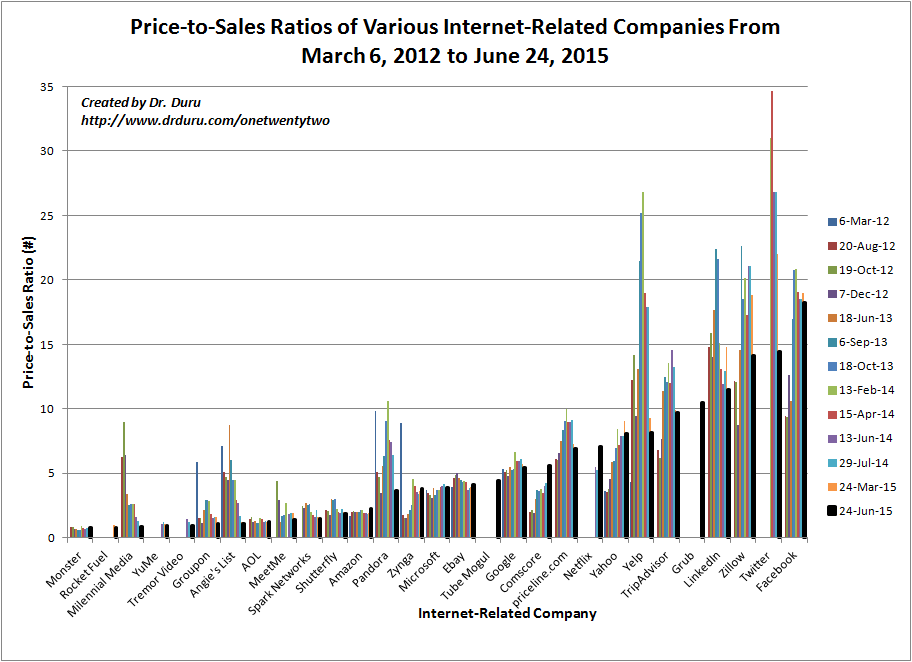
Source for valuations: Yahoo! Finance
Facebook’s ascendance comes with a lot of momentum. Many commentators are talking about the company’s many money-making engines. However, the chart suggests that the market has topped out on how much it is willing to pay for FB’s sales. Further price appreciation will have to keep coming from sales and earnings growth and not valuation expansion.
Another key take-away from this comparison chart is that a P/S ratio of around 5 continues to serve as an important dividing line anchored by Google (GOOG). One company, comScore (SCOR), has managed to cleanly hurdle this line in the past three years. That stock has been hitting new all-time highs since last October. Pandora (P) is the most recent company to fall below that threshold. Pandora is feeling renewed pressure from competitors with Apple expansion into music streaming representing the latest intrusion. The valuation chart suggests that this kind of downward momentum in valuation will not likely recover back above the 5 threshold.
Above the 5 threshold, many of the companies have come down significantly in valuation in recent snapshots. Given these declines, Carl Icahn’s complaint about stock market valuations after he sold the rest of his stake in NFLX caught my attention. Icahn did not complain about NFLX’s valuation, so it is hard to gauge whether he would think all the stocks above NFLX are too expensive. He talked earnings not sales and complimented Netflix as being “a great company.” His main complaint about stocks is that the S&P 500 is at 17 or 18 times earnings that are suspect given many are “sort of fudged.” (For reference, NFLX is at 177 trailing and 213 forward P/Es and 7.8% of the float is sold short).
Still, within this universe of stocks, a relative compression of valuations has already occurred and produced some interesting buying/trading opportunities. One of the most interesting is Yelp, Inc. (YELP) which is currently trading sideways waiting for a suitor to buy the company. When news hit the street on May 7th that YELP could be looking to sell itself, the stock almost recovered its entire post-earnings 23% gap down. It took one more day to close that gap, but the stock has drifted downward since then. At this point, I think hedged plays on YELP make the most sense.
The valuation compression on LinkedIn (LNKD) is also interesting. The company’s earnings performance has been extremely choppy since it started a recovery from a persistent downtrend from late 2013 to early 2014. Just from the perspective of volatility, I like the odds of a lurch much higher in the next earnings or two. It should pay to be patient with LNKD because it has built a major competitive advantage in the business of recruiting and job hunting. A tightening labor market and on-going economic recovery should further solidify LNKD’s performance over time.
Comparative valuations can reveal many interesting trading and investing ideas. I am hedging my bets with what amounts to a pairs trade going short FB. Either FB’s tide will sooner or later lift other boats, or the stock is simply one of the last to feel the recent pain of swift valuation compression.
In the near future, I hope to overhaul this chart by replacing some of the laggards on the left-hand side with some of the more interesting recent IPOs in the internet space.
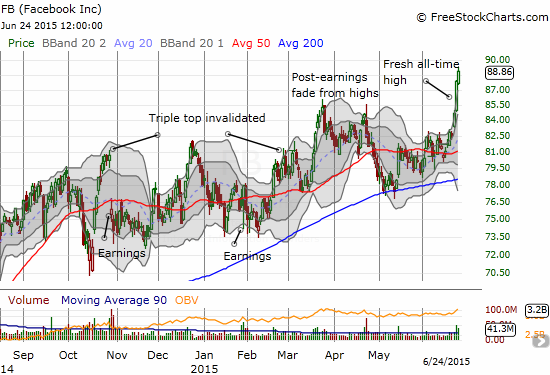
Source: FreeStockCharts.com
Be careful out there!
Full disclosure: long LNKD call spread, long GOOG call options, long NFLX call options, long YAHOO, long Z, long TWTR call spread, short FB