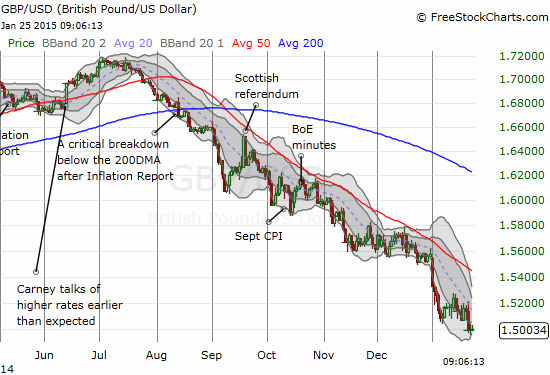
I have not written about the British pound (FXB) in a long time. I hope to get back in the groove soon because I think in the coming weeks and months, the British pound may be the only good option for fading the U.S. dollar (UUP) whenever the moment arises (GBP/USD). I am currently using it as a hedge on all my long U.S. dollar plays. The next big caveat for the British pound is fresh election drama in May.
This week could be a pivotal week with both a monetary decision coming from the Federal Reserve and GDP coming from the UK. A looming Bollinger Band (BB) squeeze is appropriately raising the stakes on the fundamentals. If it does not resolve into a big move (up or down) this week, I expect it to do so next week. As a reminder, the Bollinger Band defines the ranges of expected volatility. I now draw my charts showing two BBs relative to the 20-day moving average (DMA). The first, marked by the darkly shaded area, is roughly 1 standard deviation from the 20DMA. The second, extending beyond the first with the lightly shaded area, is roughly 2 standard deviations from the 20DMA.

Source: FreeStockCharts.com
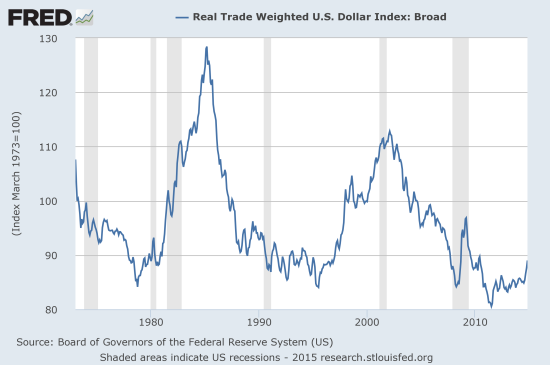
As a reminder, here is a long-term chart of the U.S. dollar index showing how much upside exists if the current rally does indeed turn out to be the mere beginnings of a secular bull run for the greenback. In that case, the pound will do a lot better against currencies that look to extend weakness for some time to come (like the euro and the Australian dollar). Note that the St. Louis Fed has only updated the chart below through November, 2014. At that time, the real trade weighted U.S. dollar index against a broad range of currencies hit 89.

Source: St. Louis Federal Reserve
Be careful out there!
Full disclosure: net long the U.S. dollar, net short the Australian dollar
