(This is an excerpt from an article I originally published on Seeking Alpha on October 30, 2014. Click here to read the entire piece.)
Two weeks ago, the market was in the final days of an relatively swift corrective phase. At that time I claimed that the Australian dollar (FXA) stood between “here and a larger correction.” The piece was a continuation of my focus this year on the signalling/confirming significance of the way the Australian dollar (FXA) trades against the Japanese yen (FXY). Once again, as I had hoped, AUD/JPY provided clues for a major turning point for the market.
{snip}
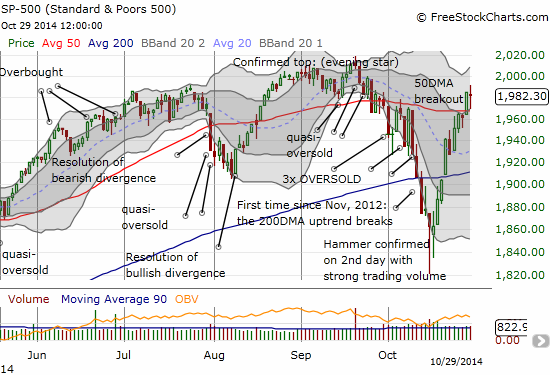
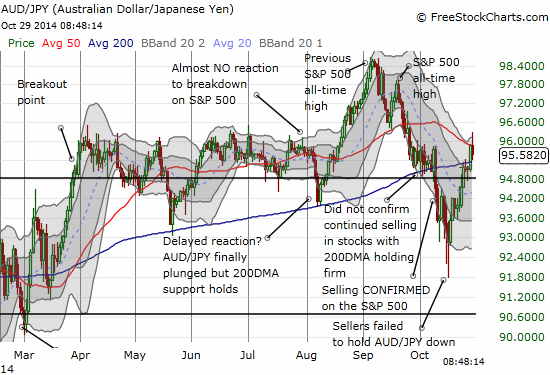
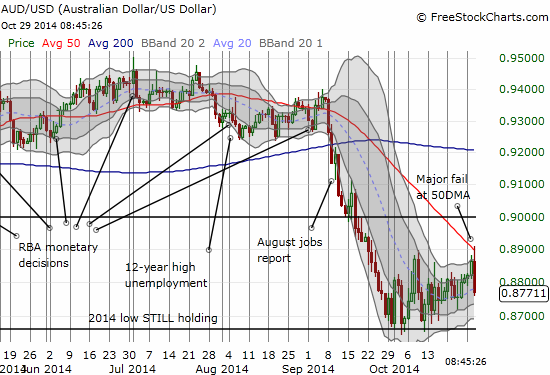
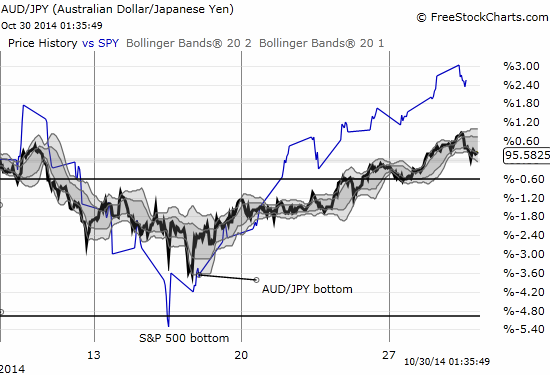
This close relationship begs the question of quantifying the exact correlation between AUD/JPY and the S&P 500. It turns out that the overall correlation is positive but probably not strong enough to use for trading day-to-day. {snip}
Source for charts: FreeStockCharts.com
I calculated several correlations excluding Sundays (foreign exchange markets are open on Sunday before U.S. markets open for business on Monday). {snip}

Almost no matter the timeframe, the correlations remain relatively consistent. They are all positive but not strong. I next wondered whether a time lag existed with a stronger correlation, as in the case of the October bottom. {snip}
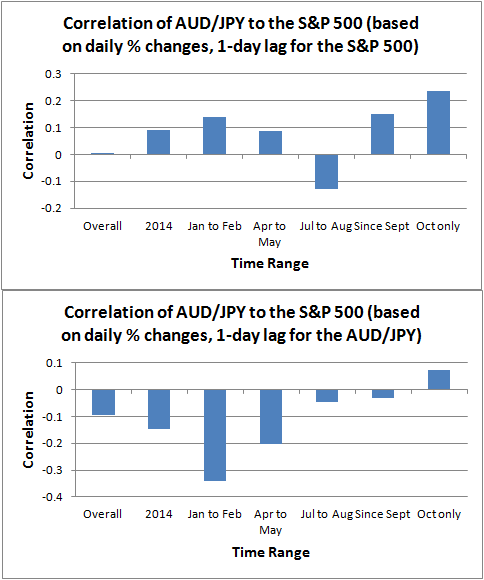
So where does this leave the trade going forward? Since 2010, October has produced the low for the rest of the year for AUD/JPY. This makes sense given that November begins a seasonally stronger period for the stock market and thus sentiment and attitudes toward risk. I see every reason to expect the same to close out 2014.
{snip}
All that being said, IF AUD/JPY does suddenly turn south ahead of a similar move in the S&P 500, my alarm bells will be ring anew.
{snip}
Be careful out there!
(This is an excerpt from an article I originally published on Seeking Alpha on October 30, 2014. Click here to read the entire piece.)
Full disclosure: net long the Australian dollar, net long the Japanese yen
