
On November 6th, I identified a budding downtrend for Tesla (TSLA). The remaining portion of the downtrend only lasted another two weeks before a consolidation phase took over. I switched my bias from bearish to bullish at that point. A tremendous breakout on December 3rd confirmed that the primary downtrend had ended, and the 50-day moving average (DMA) immediately became the upside target. After more churn for over a week, TSLA finally punched upward the last two trading days to tag the 50DMA. I took that opportunity to sell out my position. Almost on schedule, TSLA completely faded backward, ending the day essentially flat.
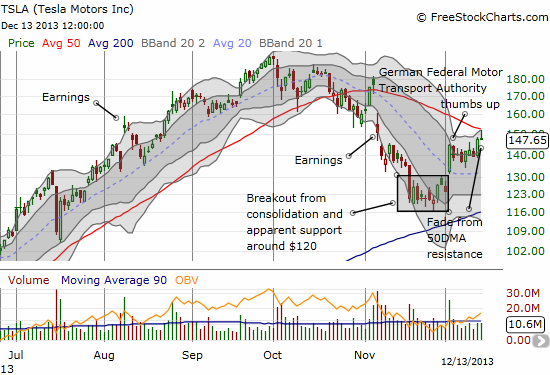
Source: FreeStockCharts.com
While TSLA made a picture-perfect failure at 50DMA resistance, I do not think this is a time to dive in bearish unless perhaps you are a day trader. The current momentum remains to the upside and the stock could easily gap up over resistance at any time given this current renewed momentum. I could not get bearish again on TSLA until sellers provided some major confirmation: for example, erasing Thursday’s gain with a close below $138. Even then, there is no clear bearish case. Moreover, the 200DMA is rapidly rushing upward to meet the stock. I prefer to watch how things develop from here between the critical DMAs and keep it simple:
- A continued breakout above the 50DMA re-establishes the bullish case. The new upside target would be a complete reversal of the losses from the last earnings report.
- A successful retest of the 200DMA generates a fresh short-term opportunity to play a bounce higher.
- A breakdown below the 200DMA establishes a firm bearish case and likely a new primary downtrend
Be careful out there!
Full disclosure: no positions