(T2108 measures the percentage of stocks trading above their respective 40-day moving averages [DMAs]. It helps to identify extremes in market sentiment that are likely to reverse. To learn more about it, see my T2108 Resource Page. You can follow real-time T2108 commentary on twitter using the #T2108 hashtag. T2108-related trades and other trades are posted on twitter using the #120trade hashtag)
T2108 Status: 61.0%
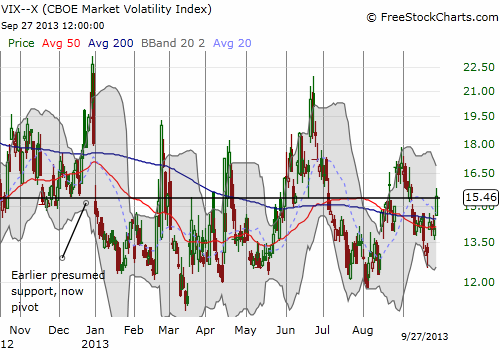
VIX Status: 15.5 (up 10%)
General (Short-term) Trading Call: Hold
Active T2108 periods: Day #64 over 20% (overperiod), Day #89 under 70%
Reference Charts (click for view of last 6 months from Stockcharts.com):
S&P 500 or SPY
SDS (ProShares UltraShort S&P500)
U.S. Dollar Index (volatility index)
VIX (volatility index)
VXX (iPath S&P 500 VIX Short-Term Futures ETN)
EWG (iShares MSCI Germany Index Fund)
CAT (Caterpillar)
Commentary
In the last T2108 Update, I guessed that the S&P 500 would meander in the absence of a fresh catalyst. As we stand on the edge of the precipice of a U.S. budget showdown, I am realizing that the unfolding drama should be the catalyst. Yet, it is still hard to believe this drama will be a major catalyst given the relative calm in markets going in. T2108 is meandering and remains trapped between 60 and 70%. The S&P 500 has slowly parachuted ever closer to a retest of its 50DMA. On Friday, the VIX showed some excitement by popping 10%. It stopped – yes, you guessed it – right at the magical pivot point that has marked the VIX action for many, many months now.


In the last update, I also pointed out that emerging markets have not benefited from lower bond yields in the U.S. Both the iShares MSCI Emerging Markets ETF (EEM) and the iShares JPMorgan USD Emerging Markets Bond ETF (EMB) continue “gentle” declines. EEM has broken below its 200DMA. Of course, if U.S. bonds are now rallying as some kind of counter-intuitive safety trade, then it makes perfect sense that EEM and EMB should continue to decline. I continue to like either one as hedges on any calamities in the next few weeks.
Until the market gets its next catalyst, I do not think T2108 will have much else to say. The bullish divergence with the S&P 500 is interesting, but past experience has demonstrated that any interpretation of such divergences, bearish or bullish, are subject to a high amount of error. I can only say that it seems that a solid core of the market is resisting the temptation to join the S&P 500 lower.
Daily T2108 vs the S&P 500

Black line: T2108 (measured on the right); Green line: S&P 500 (for comparative purposes)
Red line: T2108 Overbought (70%); Blue line: T2108 Oversold (20%)
Weekly T2108

*All charts created using freestockcharts.com unless otherwise stated
Related links:
The T2108 Resource Page
Expanded daily chart of T2108 versus the S&P 500
Expanded weekly chart of T2108
Be careful out there!
Full disclosure: long EEM strangle (out-of-money calls and puts), long VXX

Over the weekend, the mainstream media began to repeat the theory (apparently based mostly on what Mr. Boehner has said) that the Republicans have now resolved to shut down the government as a last-ditch way to stop implementation of the Affordable Care Act. Of course, the media is a moron, but the point is this is a drastic change from the tone of last week, and likely elicited the planned actions of market participants who were waiting for such a signal.
The market evidently is selling US stocks, and buying the yen and the euro.
And yet I would expect the market under such a circumstance to be even lower. Moreover, the yen got furiously sold throughout the day. I still don’t understand what happened there!