(T2108 measures the percentage of stocks trading above their respective 40-day moving averages [DMAs]. It helps to identify extremes in market sentiment that are highly likely to reverse. To learn more about it, see my T2108 Resource Page. You can follow real-time T2108 commentary on twitter using the #T2108 hashtag. T2108-related trades and other trades are posted on twitter using the #120trade hashtag)
T2108 Status: 70.3% (1 st day of overbought period following a 1-day rest from the previous 31-day overbought period
VIX Status: 12.3
General (Short-term) Trading Call: Sell some longs, initiate a small short position.
Reference Charts (click for view of last 6 months from Stockcharts.com):
S&P 500 or SPY
SDS (ProShares UltraShort S&P500)
U.S. Dollar Index (volatility index)
VIX (volatility index)
VXX (iPath S&P 500 VIX Short-Term Futures ETN)
EWG (iShares MSCI Germany Index Fund)
CAT (Caterpillar)
Commentary
This update is late given I am writing after market opens on February 20th, but I want to mark the beginning of a fresh overbought period.
Given the rest between overbought periods was just one day, one could argue that the last (31-day) overbought period did not really end. I hope in the near future to generate some rules about these specific cases. If this is really just an extension of the last overbought period, then the strategy is to buy the dips and sell quick and to forget about shorting until some other red flag technical emerges (like breaking Feb 19th’s low). But assuming this is a new overbought period, then initiating a small short position makes sense. Let’s call this a “conservative” versus “aggressive” strategy, respectively. For now, I have chosen the aggressive strategy and bought a small handful of SSO puts yesterday.
Going forward, I will review this new overbought period in the context of immediately following a 31-day overbought period. The analysis may get even more messy than usual, but I think the dual view is appropriate. In this unprecedented era of aggressive money printing and accomodative monetary policy, extreme overbought conditions have become standard fare and must be respected. In fact, I am starting to wonder whether my mental model should be one that assumes the market’s “natural” bias is to converge on overbought periods.
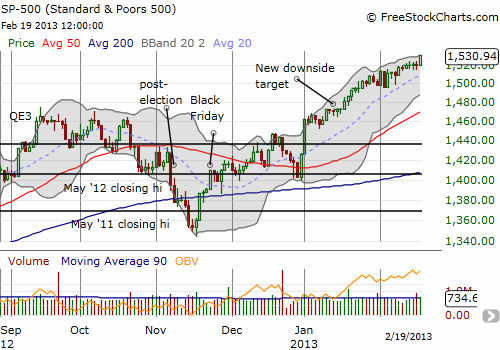
Here is yesterday’s chart of the S&P 500. The index rallied almost 0.8%. For this kind of pop, I would have expected T2108 to enter the new overbought period with more fanfare. So, I am still very wary that T2108’s reluctant behavior is demonstrating a thinning of participation in the overbought rally.

Daily T2108 vs the S&P 500

Black line: T2108 (measured on the right); Green line: S&P 500 (for comparative purposes)
Red line: T2108 Overbought (70%); Blue line: T2108 Oversold (20%)
Weekly T2108

*All charts created using freestockcharts.com unless otherwise stated
Related links:
The T2108 Resource Page
Expanded daily chart of T2108 versus the S&P 500
Expanded weekly chart of T2108
Be careful out there!
Full disclosure: long VXX shares and puts
