(T2108 measures the percentage of stocks trading above their respective 40-day moving averages [DMAs]. It helps to identify extremes in market sentiment that are highly likely to reverse. To learn more about it, see my T2108 Resource Page. You can follow real-time T2108 commentary on twitter using the #T2108 hashtag. T2108-related trades and other trades are posted on twitter using the #120trade hashtag)
T2108 Status: 73.4% (30th overbought day)
VIX Status: 13.0
General (Short-term) Trading Call: Buy on dips and sell quick.
Reference Charts (click for view of last 6 months from Stockcharts.com):
S&P 500 or SPY
SDS (ProShares UltraShort S&P500)
U.S. Dollar Index (volatility index)
VIX (volatility index)
VXX (iPath S&P 500 VIX Short-Term Futures ETN)
EWG (iShares MSCI Germany Index Fund)
CAT (Caterpillar)
Commentary
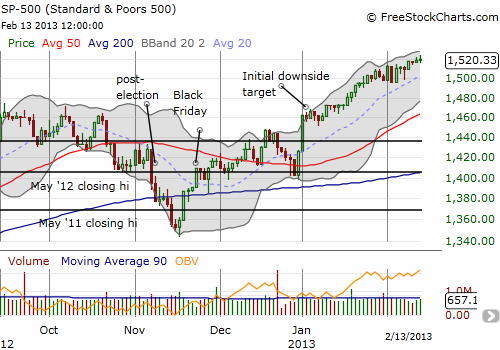
My last T2108 Update was a week ago. Since then, the S&P 500 (SPY) has gained 0.6% with very small ranges on most days. This is the very definition of watching paint dry.

At the same time the S&P500 is moving in slow motion, T2108 has made several new lows for the overbought period. The different directions of T2108 and the S&P 500 have established a very mild bearish divergence which I expect to get resolved to the downside at any moment soon. Something roughly similar happened at the tail end of 2012’s strong start with a historic overbought period. After it ended, T2108 plunged steeply and the S&P 500 sold off quickly. The dip yielded eventually to fresh highs for the year and one more brief overbought period before the May swoon took the index back to its 200DMA. See the T2108 chart below for some context.
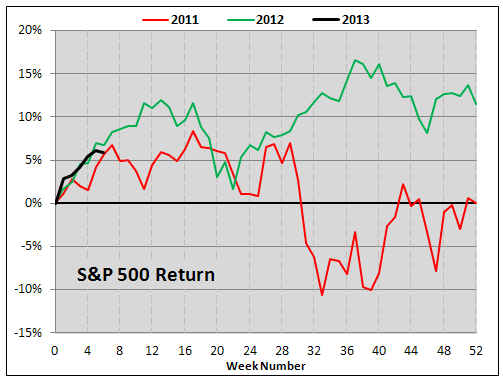
I also like the following chart from Schaeffer’s Research that compares the paths of the S&P 500 in 2011, 2012, and 2013. Three fast starts in a row suggest another May/June sell-off, but the wildcard is whether the summer continues the sell-off or whether it delivers a recovery.

Although the threat looms of a sudden correction to the current rally, the overbought period has crossed the bullish threshold of 25 days in length. It is at this point that I switch to a buy-the-dip and sell quick strategy instead of one that looks for a point to short. The strategy ends with the end of the overbought period and at that point I will give consideration again to establishing fresh puts in SSO (the last batch are likely to expire this Friday worthless). As a reminder, my analysis of overbought periods “Trading Strategies for an Overbought S&P 500 Using the Percentage of Stocks Trading Above Their 40DMAs (“T2108″)” demonstrates that when this overbought period ends, it will likely leave the S&P 500 with a gain overall. Moreover, as this period drags on, the expected maximum gain increases nearly linearly. Both of these factors are supportive of buying dips. Also note that at 30-days long, this overbought period’s maximum return is below expectations.
So far, the S&P 500 has not provided any good opportunities to buy dips. The intraday ranges have been exceptionally narrow. Instead, individual stocks have provided some intriguing opportunities, and I have laid out some of them in chart reviews and other posts. Note well that these plays are NOT part of the T2108 strategy and instead represent case-by-case opportunities.
Daily T2108 vs the S&P 500

Black line: T2108 (measured on the right); Green line: S&P 500 (for comparative purposes)
Red line: T2108 Overbought (70%); Blue line: T2108 Oversold (20%)
Weekly T2108

*All charts created using freestockcharts.com unless otherwise stated
Related links:
The T2108 Resource Page
Expanded daily chart of T2108 versus the S&P 500
Expanded weekly chart of T2108
Be careful out there!
Full disclosure: long VXX shares and puts, long SSO puts
