(T2108 measures the percentage of stocks trading above their respective 40-day moving averages [DMAs]. It helps to identify extremes in market sentiment that are highly likely to reverse. To learn more about it, see my T2108 Resource Page. You can follow real-time T2108 commentary on twitter using the #T2108 hashtag. T2108-related trades and other trades are posted on twitter using the #120trade hashtag)
T2108 Status: 65.4%
VIX Status: 15.0
General (Short-term) Trading Call: Hold (consider shorting)
Reference Charts (click for view of last 6 months from Stockcharts.com):
S&P 500 or SPY
SDS (ProShares UltraShort S&P500)
U.S. Dollar Index (volatility index)
VIX (volatility index)
VXX (iPath S&P 500 VIX Short-Term Futures ETN)
EWG (iShares MSCI Germany Index Fund)
CAT (Caterpillar)
Commentary
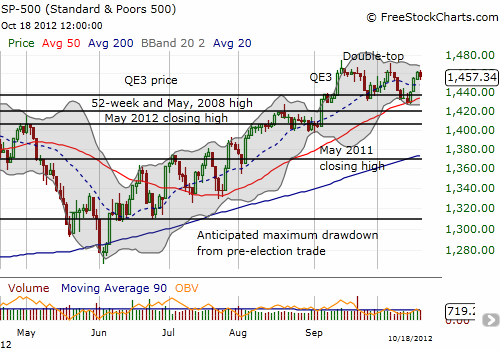
T2108 was 67.8% yesterday. The S&P 500 had jumped three days straight, each time closing near the highs of the day. This rally was a continuation of what I called an “obligatory bounce” off the 50DMA on Monday. At 1460.91 the S&P 500 was within five points of a new all-time closing high. The market seemed set to make a statement by breaking through the double-top. Instead, the market stalled today as earnings news weighed in.

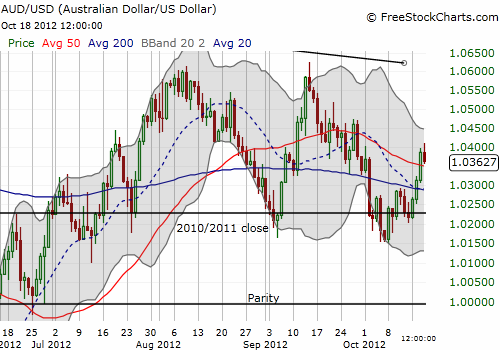
Even the Australian dollar (FXA) seemed poised to pop. It remains linked at the hip with the fate of the S&P 500 and rose along with the index the past three days. Finding support at the 2010/2011 close and breaking through the 200 and then the 50DMA. It now rests on top of the 50DMA waiting for the next catalyst.

The Australian dollar’s resilience is impressive especially given recent rate cuts from the Reserve Bank of Australia (RBA). I am keeping a close eye on on how the currency proceeds as the Federal Reserve’s QE3 continues to display a minor impact.
The market is at a spot where shorts make sense, even without T2108 quite hitting overbought. A tight stop exists directly above the intraday 52-week high at 1472. The huge caveats are 1) it is earnings season, and 2) next week is another rate decision from the Federal Reserve. Earnings spoiled the mood today and will continue to have a lot of dampening potential as big companies are putting in poor headlines. However, I strongly suspect that just one positive surprise could immediately turn the mood. I am not expecting fireworks from the Fed just two weeks away from the Presidential election, but the market could decide otherwise. Brace yourselves!
Daily T2108 vs the S&P 500

Black line: T2108 (measured on the right); Green line: S&P 500 (for comparative purposes)
Weekly T2108

*All charts created using freestockcharts.com unless otherwise stated
Related links:
The T2108 Resource Page
Expanded daily chart of T2108 versus the S&P 500
Expanded weekly chart of T2108
Be careful out there!
Full disclosure: no positions!
