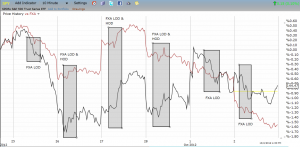
In “How To Estimate Intraday Moves For The S&P 500 Using The Australian Dollar“, I quantified the relationship between the Australian dollar and the S&P 500 on an intraday basis. However, I did not provide any charts demonstrating the relationships. The chart below tracks the intraday relationships between SPY as a proxy for the S&P 500 and FXA as the proxy for the Australian dollar (AUD/USD). I used the ETFs because both open and close at the same time as opposed to AUD/USD which trades continuously from Sunday evening to Friday. The chart covers the end of trading on September 24th until the close of trading on October 2nd. Within this period the Reserve Bank of Australia cut rates ahead of trading on October 2nd.
The jagged red line represents FXA which traded better than SPY over the given time period until October 1st. The jagged black line represents SPY. The grey rectangles with black outline highlight what I think are the critical time periods in each day’s trading. The labels above or below these rectangles indicate whether AUD/USD traded at its lows or highs of the day. These points are important given my conclusion that the Australian dollar largely leads the S&P 500’s performance.
Click for more detail…

Source: FreeStockCharts.com
Follow the chart for each day and look for where the SPY is trading relative to the highlighted areas and how they mostly support my theory that the performance of the Australian dollar leads the S&P 500 performance (daily AND intraday).
- Sept 25: FXA low-of-the-day (LOD) confirms SPY LOD.
- Sept 26: FXA high-of-the-day (HOD) happens soon after a LOD. The whiplash confirmed the bounce of the SPY.
- Sept 27: FXA high-of-the-day (HOD) happens soon after a LOD. FXA continue to power upward, confirming the SPY move higher.
- Sept 28: FXA high-of-the-day (HOD) happens soon after a LOD. Lots of whiplash. SPY makes a new HOD even though FXA already in decline. This marks the peak for the day.
- Oct 1: FXA declines most of the day and pulls SPY with it.
- Oct 2: Same as previous day except SPY experiences strong surge into the close.
While this chart helped me identify and quantify the relationships between the Australian dollar the S&P 500 on an intraday basis, I also realized that it is very hard to trade on these data. The intraday timing leave little room for initiating trades BUT trades can be closed out based on these data. For example, selling SPY longs when it appears that AUD/USD has hit peak and/or is in sharp decline.
I cannot guess what may happen to end these close relationships, but as long as they are working, I remain closely attentive to them on an intraday and daily basis.
Be careful out there!
Full disclosure: long SSO calls
