(This is an excerpt from an article I originally published on Seeking Alpha on August 17, 2012. Click here to read the entire piece.)
I have written multiple times about the usefulness of the Australian dollar (FXA) as an early indicator or confirming signal for directional trading on the S&P 500 (SPY). For an example, see “Another Key Bullish Divergence Between The Australian Dollar And The S&P 500“. I have stayed on alert for any signs of a bearish divergence between the Australian dollar and the S&P 500. Such a critical juncture may have finally arrived.
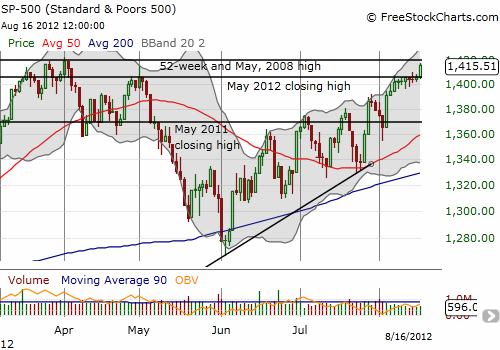
The Australian dollar experienced an important breakout against the Japanese yen last week. The currency has made little progress since then. Even more importantly, the Australian dollar has stalled out against the U.S. dollar. At current levels, AUD/USD rests at the April highs which served as an important breakout point in late July and early August. Meanwhile, the S&P 500 has broken out toward fresh multi-year highs.


Source: FreeStockCharts.com
If history repeats itself, this early divergence between AUD/USD and the S&P 500 (on a daily level) could signal the beginning of the end for the current rally in stocks despite the increasingly bullish outlook. The last major divergence occurred after AUD/USD last topped out in late February of this year. {snip}
{snip}
Be careful out there!
(This is an excerpt from an article I originally published on Seeking Alpha on August 17, 2012. Click here to read the entire piece.)
Full disclosure: net short Australian dollar
