(This is an excerpt from an article I originally published on Seeking Alpha on August 2, 2012. Click here to read the entire piece.)
A month ago I explained how the three months leading into a U.S. Presidential election featuring an incumbent tend to represent a bullish period (see “The Positive Trade When Incumbent Presidents Run For Re-Election“). While I provided the graphs showing the tempting upside opportunities on the S&P 500 (SPY), I neglected to include the risk of drawdowns. It turns out the the this bullish period also features very mild sell-offs, especially relative to the typical turbulence the stock market faces between August and October.
{snip}
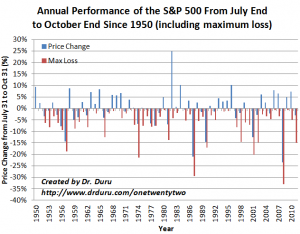
Annual Performance of the S&P 500 From July End to October End Since 1950 (including maximum drawdown or loss)
- average gain: 0.09%
- median gain: 0.20%
- average drawdown: -6.37%
- median drawdown: -4.29%

{snip}
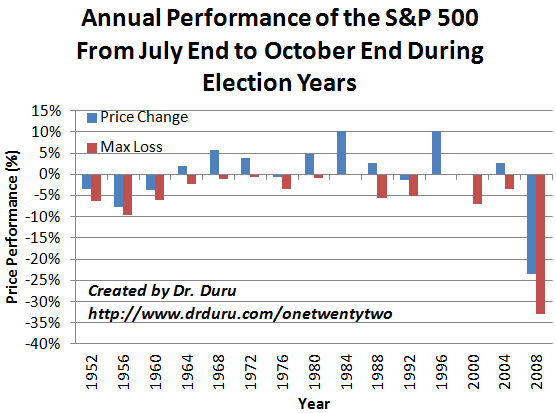
Annual Performance of the S&P 500 From July End to October End During Election Years
- average gain: 0.11%
- median gain: 2.02%
- average drawdown: -5.60%
- median drawdown: -3.49%

{snip}
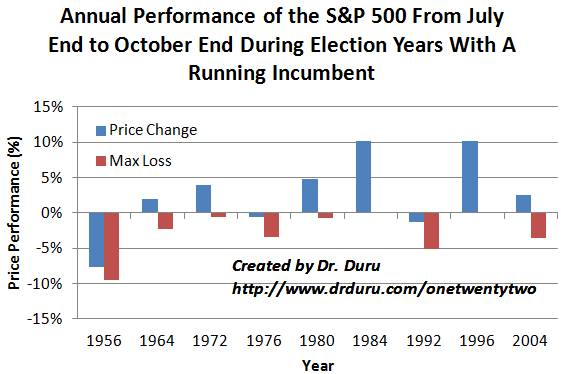
Annual Performance of the S&P 500 From July End to October End During Election Years With A Running Incumbent
- average gain: 2.69%
- median gain: 2.59%
- average drawdown: -2.78%
- median drawdown: -2.24%

Source: Dates for elections from wikipedia, prices from Yahoo!Finance
{snip}
Be careful out there!
(This is an excerpt from an article I originally published on Seeking Alpha on August 2, 2012. Click here to read the entire piece.)
Full disclosure: long SDS, long SSO puts
