(This is an excerpt from an article I originally published on Seeking Alpha on July 24, 2012. Click here to read the entire piece.)
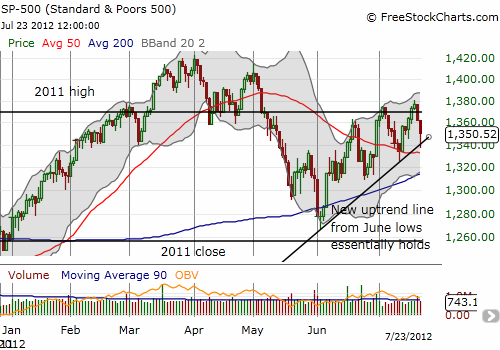
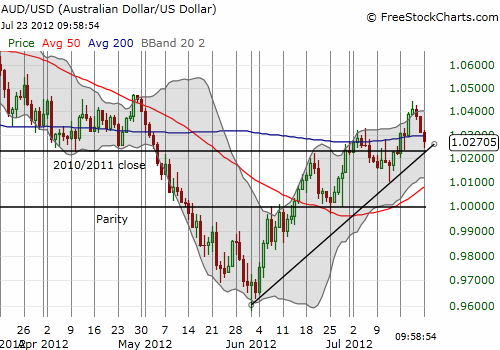
The Australian dollar (FXA) continues to provide fascinating, and profitable, examples of its strong relationship with the S&P 500 (SPY). {snip} On July 23rd, another big sell-off day, the Australian dollar provided a handy indicator for a bounce in the S&P 500.
Soon after the open of trading and a 1.7% loss for the S&P 500, I tweeted the following:
“Australian dollar still lagging poor technicals on $SPY. Has not yet broken its uptrend from June low on $AUDUSD. Watching for confirmation.”
The S&P 500 had broken its uptrend from the June lows, and I was waiting for the Australian dollar to do the same. I was expecting the S&P 500 to continue dropping to its 50-day moving average (DMA). Instead, the S&P 500 began to turn upward, and I immediately assumed that marked the low of the day. {snip}
{snip}


So far, I have noted important divergences on days when the S&P 500 sells off. I have not yet identified useful correlations on up days.
{snip}
Be careful out there!
(This is an excerpt from an article I originally published on Seeking Alpha on July 24, 2012. Click here to read the entire piece.)
Full disclosure: net short the Australian dollar, long SDS and SSO puts
