(T2108 measures the percentage of stocks trading above their respective 40-day moving averages [DMAs]. To learn more about it, see my T2108 Resource Page. You can follow real-time T2108 commentary on twitter using the #T2108 hashtag. T2108-related trades and other trades are posted on twitter using the #120trade hashtag)
T2108 Status: 50.9%
VIX Status: 20.5 (Closed at 50DMA and breakout point for 2011 summer swoon)
General (Short-term) Trading Call: Hold
Reference Charts (click for view of last 6 months from Stockcharts.com):
S&P 500 or SPY
SDS (ProShares UltraShort S&P500)
U.S. Dollar Index (volatility index)
VIX (volatility index)
VXX (iPath S&P 500 VIX Short-Term Futures ETN)
EWG (iShares MSCI Germany Index Fund)
CAT (Caterpillar)
Commentary
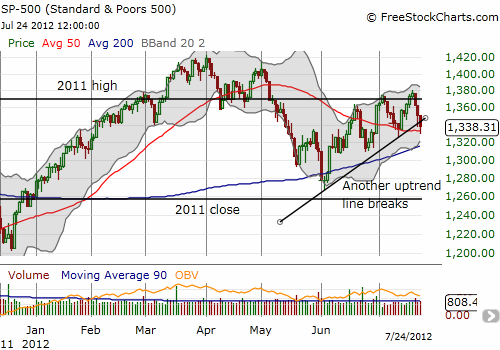
T2108 plunged again as the stock market’s sell-off steepened. (Incredibly, I realized from Nightly Business Report that Monday was the eighth down Monday in a row – something unseen for many years!). The VIX met resistance once again at the 50DMA and the breakout point for the summer 2011 swoon. Unlike the previous day, the VIX did not pull back even as the S&P 500 rallied a bit into the close again. The S&P 500 bounced off its 50DMA support, but broke through another uptrend line from the June lows.

This breakdown makes it even more likely the S&P 500 will soon retest its 200DMA support. At such a point, T2108 could even approach oversold levels.
Still, I took this opportunity to sell my remaining SSO puts and take profits. Note that the next major wildcard is another Federal Reserve meeting next week (July 31st to Aug 1st). With the stock market apparently clinging to the hope and expectation of more stimulus from the Fed, something big and sustained could launch from that catalyst. Moreover, note well that July 31st kicks of the typically bullish three months leading into a Presidential election. For more details see “The Positive Trade When Incumbent Presidents Run For Re-Election.”
In other words, with bearish technicals heading into potential bullish catalysts, the market seems set up for a major move one way or another in the next week. Stay tuned!
Daily T2108 vs the S&P 500
Click chart for extended view with S&P 500 fully scaled vertically (updated at least once a week)

Black line: T2108 (measured on the right); Green line: S&P 500 (for comparative purposes)
Weekly T2108

*All charts created using freestockcharts.com unless otherwise stated
Related links:
The T2108 Resource Page
Expanded daily chart of T2108 versus the S&P 500
Expanded weekly chart of T2108
Be careful out there!
Full disclosure: long SDS; long VXX shares; short VXX call spreads; long VXX puts
