(This is an excerpt from an article I originally published on Seeking Alpha on July 20, 2012. Click here to read the entire piece.)
Spotting anomalies and/or extremes continues to provide a key catalyst when it comes to trading earnings.
On July 18th, I issued a series of tweets describing a potential bullish setup to trade on the earnings report for F5 Networks (FFIV):
{snip}
Here is a distribution of FFIV’s pre-earnings one-day performance since 2000.
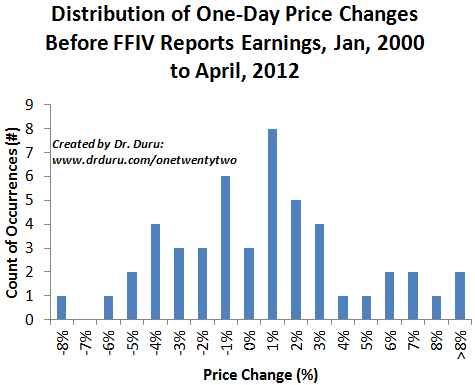
Source: Earnings dates from briefing.com, stock price data from Yahoo!Finance
{snip} More recently, when FFIV jumped 7.3% ahead of earnings April 20, 2011, FFIV jumped another 7.1% after earnings. Given I apply a lot more weight to recent earnings reactions, I found enough evidence to motivate a deeper investigation into the history of FFIV’s post-earnings responses.
I looked for correlations between historical price action and the post-earnings response. As implied above in the tweets, I did not find a smoking gun, but I also did not find evidence to dissuade me from the trade. {snip}
Here is a summary of the most important conclusions from these charts:
{snip}
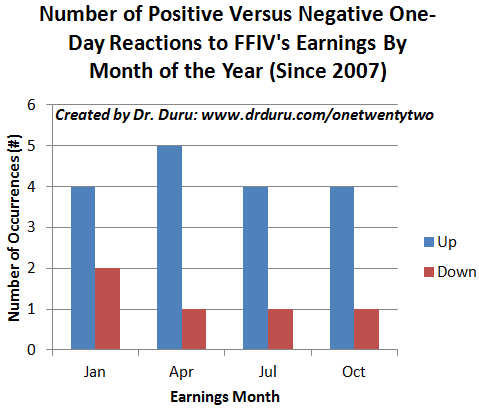
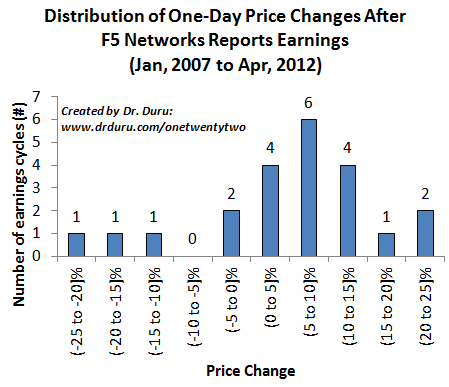
Click image for more larger view…
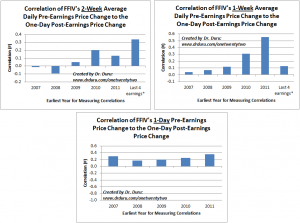
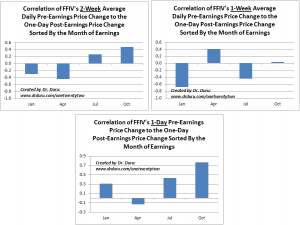
{snip}…the dominance of large, positive post-earnings reactions combined with the performance from April, 2011 convinced me this trade was worth a try from the bullish side. I did not purchase options because the premiums were too high given the downside risks. As an alternative, I purchased a small amount of shares with an assumption of potential downside to recent lows. {snip} As FFIV approached its 50-day moving average (DMA), I sold my shares and tweeted:
{snip}
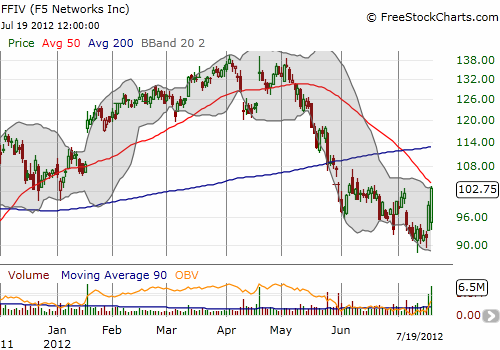
Source: FreeStockCharts.com
Each earnings trade seems to provide its own unique lessons. Here, context was important to swaying me to overweight evidence that supported a bullish trade. {snip}
Be careful out there!
(This is an excerpt from an article I originally published on Seeking Alpha on July 20, 2012. Click here to read the entire piece.)
Full disclosure: no positions
