(This is an excerpt from an article I originally published on Seeking Alpha on July 11, 2012. Click here to read the entire piece.)
In the past, I have only had bearish things to say about Netflix (for example, “Netflix Tags the $110 Target But More Downside To Come” from September 30, 2011). However, I feel like I can finally say something positive about the stock, even if my words are laced with caveats.
{snip}
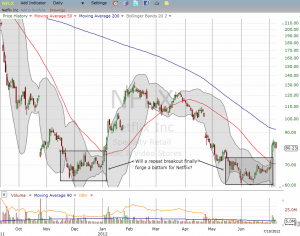
The daily chart below shows how the recent breakout is very similar to the one that began 2012. Both feature runs above the 50-day moving average (DMA). The last rally produced a 67% gain in less than six weeks and included a strong response to an earnings report. The boxes in the chart below highlight the breakout points.
Click for a larger view…

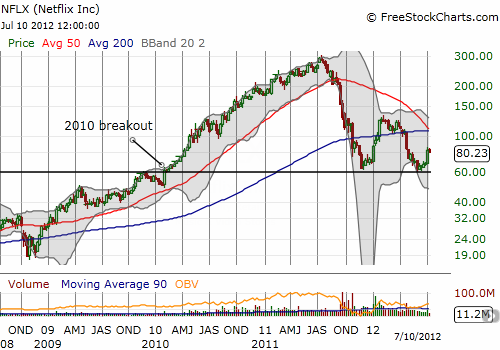
This repeat breakout is doubly important because it is coming off critical support that could mark a bottom for NFLX. The weekly chart below shows that the recent selling finally ended not only around the last bottom from November, 2011, but also right where NFLX experienced a major breakout in 2010.

Source: FreeStockCharts.com
{snip}
Be careful out there!
(This is an excerpt from an article I originally published on Seeking Alpha on July 11, 2012. Click here to read the entire piece.)
Long NFLX shares and puts; long FB
