(T2108 measures the percentage of stocks trading above their respective 40-day moving averages [DMAs]. To learn more about it, see my T2108 Resource Page. You can follow real-time T2108 commentary on twitter using the #T2108 hashtag. T2108-related trades and other trades are posted on twitter using the #120trade hashtag)
T2108 Status: 52%
VIX Status: 18.3
General (Short-term) Trading Call: Hold with a bullish bias
Reference Charts (click for view of last 6 months from Stockcharts.com):
S&P 500 or SPY
SDS (ProShares UltraShort S&P500)
U.S. Dollar Index (volatility index)
VIX (volatility index)
VXX (iPath S&P 500 VIX Short-Term Futures ETN)
EWG (iShares MSCI Germany Index Fund)
CAT (Caterpillar)
Commentary
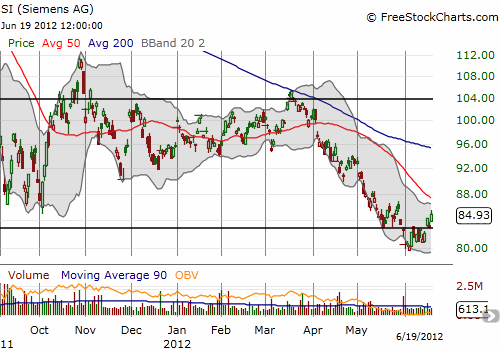
T2108 is leading the way now. At 52%, my favorite technical indicator has returned to levels last seen in the beginning of May. Meanwhile, the S&P 500 has finally closed above its 50DMA and now sits at a 5-week high. This is my official signal to get firmly bullish and firmly behind this rally. The 50DMA flips from resistance to support and a close below this line stops me out of short-term trades. I bought July calls in Siemens (SI) for my first bullish trade of this phase. SI has neatly jumped over important support that had held since 2010 until this month. A happier and more bullish market should carry the stock as high as its 200DMA is relatively short order.

I also bought a small number of SSO shares that I am looking to sell tomorrow.
I have several “buts” however! First of all, I am not comfortable getting more aggressively bullish with T2108 now closer to overbought than oversold. In fact, at its current pace, T2108 could easily become overbought by early next week. Moreover, my latest look at the Japanese yen is warning me that the risks of a fresh sell-off are high in the next several weeks (see “Yen Flashes Another Warning Even As The Australian Dollar And S&P 500 Rally Together” for more details).
The S&P 500 gained almost 1%, T2108 surged, yet the volatility index came back to close flat on the day. That stubbornness keeps me wary, but it is very possible that the volatility index will get crushed again after the Federal Reserve’s monetary policy statement Wednesday. Even so, VXX now looks very cheap, and I couldn’t resist buying fresh calls as a hedge. (VXX seems like an ideal short here once we get over the Fed decision no matter what it is. Shorting at higher prices is preferred of course).
Finally, there are now multiple layers of strong resistance still ahead for the S&P 500. Directly above is now the high from 2011 (last May) and next there is the high from May of this year. For now, I will not get overly concerned by these resistance levels. If the short-term trend is growing as strong as I think it is, each level will get broken in due time – at least absent a fresh negative catalyst.
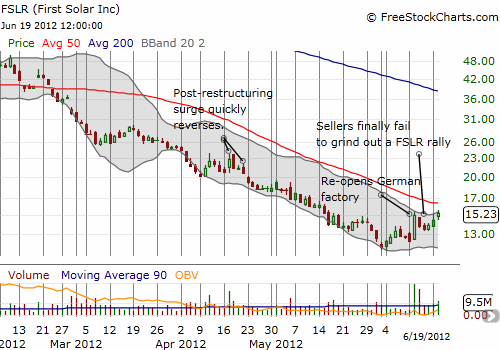
Assuming the rally continues, this should be a time where beaten up stocks get fresh bids for swift rallies. The market is full of disaster zones right now and many, many candidates exist. No surprise, one of my favorites is First Solar (FSLR). I will write more about this stock and company at another time (archives here). Until then, note that the chart shows FSLR bouncing off all-time lows with strong buying volume. For the first time since the beginning of the year, FSLR has actually maintained some upward momentum and sellers were unable to fade the sharp, 20%+ bounce from last week. In other words, FSLR could very well be at the beginning of a violent short squeeze. Solar stocks as a group should be closely watched here.

Daily T2108 vs the S&P 500

Black line: T2108 (measured on the right); Green line: S&P 500 (for comparative purposes)
Weekly T2108

*All charts created using freestockcharts.com unless otherwise stated
Related links:
The T2108 Resource Page
Expanded daily chart of T2108 versus the S&P 500
Expanded weekly chart of T2108
Be careful out there!
Full disclosure: long SDS, SSO, long VXX calls and shares, long FSLR (shares, calls, and short puts), long SI calls, net long Japanese yen
