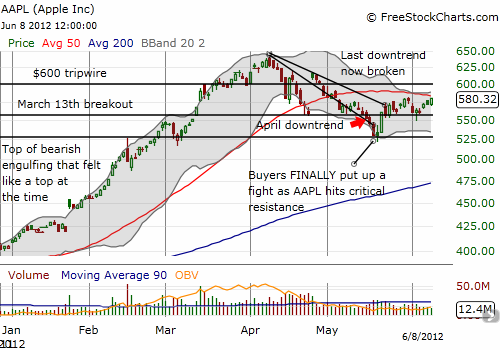
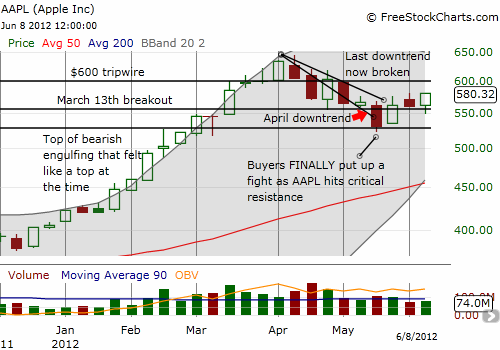
On Friday, Apple (AAPL) closed at its highs for the day and highs for the week. This has not happened since April 5th (holiday-shortened week) with AAPL a day away from its last all-time closing high. For about the next six weeks Apple sold off almost every day with one important post-earnings pop that delivered one of the best post-earnings plays I have ever analyzed. Last Friday’s close marks a subtle but definite change in momentum for Apple as the company goes into this year’s Worldwide Developers Conference (WWDC). This change can best be seen in the weekly chart. I first show the daily chart which clearly marks specific turning points and mini-trends in the stock. In particular, note that AAPL is now resting directly under resistance at its now declining 50DMA. If the WWDC is somehow a dud, we should know pretty quickly.


Source: FreeStockCharts.com
Note that trading volume has been particularly light during Apple’s brief consolidation after the last downtrend ended. This is more of a footnote than anything. Volume surges are more important in this day and time.
Be careful out there!
Full disclosure: long AAPL call and put spreads
