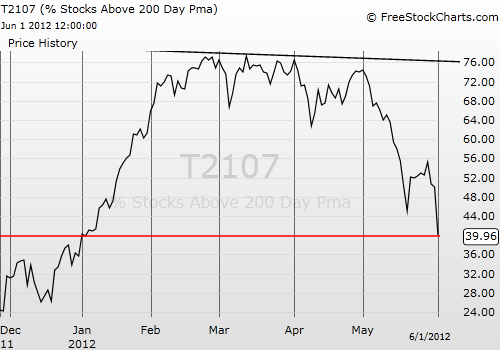
This post is a supplement to my extensive T2108 Update for June 1, 2012. T2108 is the percentage of stocks trading above their 40-day moving average. I use it to determine oversold and overbought extremes in the market. The percentage of stocks trading above their 200DMAs, also known as T2107 to users of FreeStockCharts.com, is an additional technical indicator I use for more long-term outlooks. As the S&P 500 returns all of its gains for the year, it turns out that T2107 has already done so. At 40%, T2107 is right where it closed on January 3rd. It ended 2011 at 35.7%.

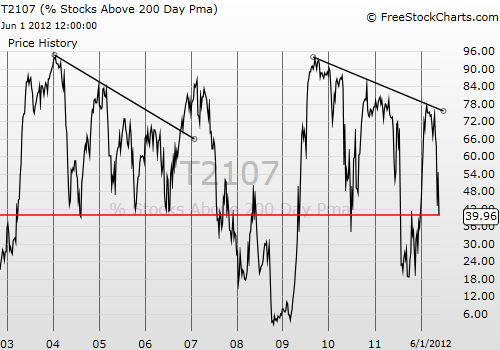
This coincidence would mean little except that it is a glaring confirmation of a longer-term downtrend in this indicator. I have written about the bearish implications of this downtrend before. It essentially suggests that the on-going rally off the March, 2009 lows is supported by fewer and fewer stocks in long-term uptrends. At some point – it is hard to know when – this downtrend must get broken to maintain the rally. Otherwise, the stock market could reach a tipping point where there simply are not enough stocks to keep the rally going. Back in 2006, a similar downtrend in T2107 was broken, but that turned out to be a false hope. The subsequent peak in February and thh failure to break it two months later were early warning signs for the bear market to come. (Notice how 40% served as a reliable bottom from 2004 to 2006 whereas 40% has meant little this time around!).

Source: FreeStockCharts.com
Be careful out there!
Full disclosure: long SDS, long SSO calls
