(This is an excerpt from an article I originally published on Seeking Alpha on May 20, 2012. Click here to read the entire piece.)
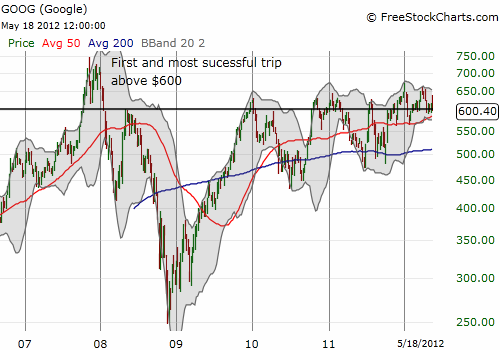
For almost five years, GOOG has not been able to make a clean break from the $600 price level. {snip}

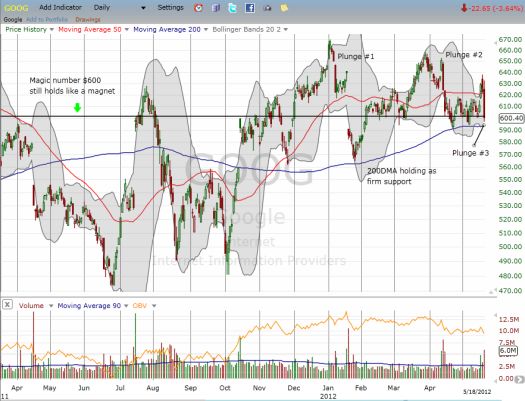
Each time GOOG peaks just above $600, the subsequent sell-off has ended at higher levels. Technicians might call this pattern a rising wedge. In 2010, the sell-off low was $437. In 2011, it was $472, $480, and finally $561. This year, the post-$600 low was $565. Most recently, GOOG has bounced immediately and sharply almost every time it has nicked the magic $600 level. The daily chart shows the predictability and reliability of these bounces. I call these GOOG’s “nine lives” around $600. In just the last 2 1/2 months, GOOG has tested or crossed the $600 fifteen times from a higher price point.

Source for charts: FreeStockCharts.com
{snip}
While the recent trading action has demonstrated GOOG’s resilience around $600, I think there are some clues that these “nine lives” are coming to an end soon. I labeled three important plunges this year. {snip}
While GOOG has predictably bounced from $600, I have actually been mostly focused on the bearish opposite of this predictability…the near certain drop back to $600. {snip}
Now that these persistent bounces around $600 seem to be coming to an end, the reward potential of the put spread increases. {snip}
Be careful out there!
(This is an excerpt from an article I originally published on Seeking Alpha on May 20, 2012. Click here to read the entire piece.)
Full disclosure: long GOOG put spread (since printing, I also got long a call)
