With each passing day in the April downtrend, Apple’s stock chart gets more and more interesting.
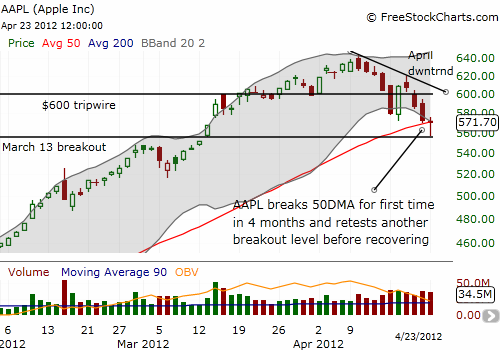
Today, Apple (APPL) almost pounded out a hammer. Given the final resting point on the 50-day moving average (DMA), I would throw caution to the wind and call today’s pattern a hammer, but I am showing some deference to the technical purists out there. A hammer pattern is typically a signal of the exhaustion of selling at the end of a downtrend. The pattern features a plunge from the open on (ideally) high selling volume followed by a same-day recovery that is strong enough to generate a close above the open. Apple closed with a very marginal increase over the open, so I imagine purists might balk a bit at calling this a hammer pattern. Stockcharts.com provides a detailed description of hammer candlestick patterns in “Introduction to Candlesticks.”
The daily chart below shows today’s hammer in the larger context of a vicious downtrend for the month of April on high selling volume. Until this trend breaks, one must assume that significant downside risks remain imminent. I would have preferred that Apple held support at the 50DMA, but hopefully the drop below and recovery washed out sellers who held stops beneath this support line. Note that an earlier wash out of sellers worked for only two days when Apple plunged sharply below $600 a week ago on April 16th.

I pointed out the March 13th breakout level in the above chart because that coincided with the a big breakout in the S&P 500 (SPY) that was first violated April 10th. The index has fought to hold onto this support ever since. Now, it seems to be Apple’s turn. (See my last T2108 Update for a close-up on the S&P 500 breakout area).
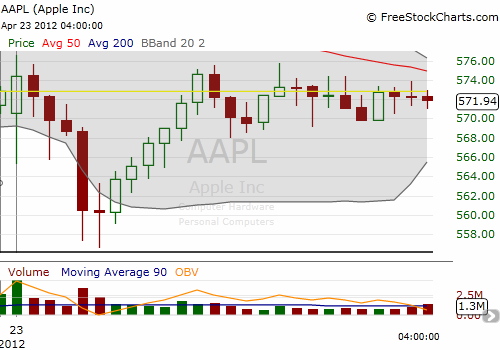
Finally, here is an intraday chart using 15-minute intervals that shows that today’s lows occurred on high selling volume (although not higher than the open). This supports the notion (hope?) that the lows today marked a final washout of sellers. The quick response by buyers after this 30-minute sell-off is also very encouraging.

Source: FreeStockCharts.com
Of course the next big issue for AAPL is its next earnings report on Tuesday evening. I earlier explained why I think the odds favor a large (one-day) upside response to earnings (see “Odds Favor A Big One-Day Upside After Apple Posts Earnings“). Reuters reported today that the options market agrees with me…except it is pricing in the potential for a large swing up OR down of 7.5% (see “Options market sees big earnings move for Apple“). Whatever happens, the response could be strong enough to readjust our technical understanding and interpretation of the stock. As an old friend used to say to me, “earnings trump technicals.” But at least in this case, the historical data on earnings are supporting the technicals as well.
Be careful out there!
Full disclosure: long AAPL call spread
