(T2108 measures the percentage of stocks trading above their respective 40-day moving averages [DMAs]. To learn more about it, see my T2108 Resource Page. You can follow real-time T2108 commentary on twitter using the #T2108 hashtag. T2108-related trades and other trades are posted on twitter using the #120trade hashtag)
T2108 Status: 37%
VIX Status: 17.2%
General (Short-term) Trading Call: Hold. (click here for a trading summary posted on twitter)
Reference Charts (click for view of last 6 months from Stockcharts.com):
S&P 500 or SPY
SDS (ProShares UltraShort S&P500)
U.S. Dollar Index (volatility index)
VIX (volatility index)
VXX (iPath S&P 500 VIX Short-Term Futures ETN)
EWG (iShares MSCI Germany Index Fund)
CAT (Caterpillar)
Commentary
For these several weeks following the historic, extended overbought period, I have had two expectations that have rung true the loudest: 1) maintain short holding periods for aggressively bullish trades, and 2) expect a lot of churn that frustrates bulls and bears. The behavior in #1 is a direct result of the expectation in #2. This week has delivered an excellent microcosm of these ideas.
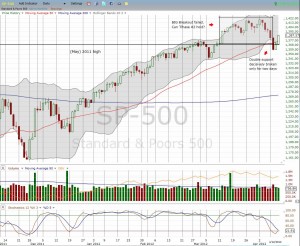
Selling on the S&P 500 reached an apparent crescendo on Tuesday, April 10, as T2108 almost hit oversold conditions. As I discussed at the time, T2108 was simply the last oversold confirmation. This selling decisively broke through critical support levels, violated the big breakout from March 13th, and compelled me to brace for further losses. What followed was a resounding rejection of that breakdown as two days of buying have placed the S&P 500 right back into the previous bullish breakout area. The losses from Tuesday are now fully reversed. The bulls have officially already taken back the reins.
Click on image to enlarge it.

Over these two days, T2108 has resolutely bounced from 21% to 27% and now 37%. This bounce gives us the final confirmation that T2108 effectively, even if not technically, hit oversold levels two days ago. I will continue to proceed as though we are in the midst of a post-oversold rally. However, my upside expectations are quite constrained given the longer-range bearish signals I pointed out earlier this week using correlations between the Japanese yen and the S&P 500 (see “Bearish Implications Of A Rare Convergence Of Extremes In Yen Vs. S&P 500 Correlations“). For now, at best, I am targeting marginal new multi-year highs. My trading bias will remain bullish as before, but I will be much more interested in buying dips than in chasing rips. My holding periods will remain short, and I will continue to hold SDS shares as a hedge. I will revisit all these rules once (if?) T2108 hits overbought again.
Speaking of hedges, looks like I dumped my VXX calls just in time and right near the recent peak. The volatility index, VIX, failed miserably in its critical test. Once again, the resistance formed by the launching point for last summer’s gut-wrenching swoon sent the VIX careening backward. Today, the VIX lost an amazing 14% while VXX lost 9%. I dipped into May VXX calls again just to enhance my hedge a little bit. I am now more hopeful on-going positions in SSO calls and VXX puts that expire next week may yet deliver some residuals. Finally, at today’s open, I sold the SSO calls I bought on Tuesday. Obviously, I wish I had held longer but I really thought resistance would hold firmer and longer on the S&P 500.
Finally, the Caterpillar (CAT) watch got VERY interesting. While CAT remains in a downtrend, it surged today by almost 5% on very high buying volume. Similarly, commodities across the board were extremely strong. These are all signs of more imminent bullish rallies. In a related development, I noticed today that the Australian dollar is experiencing a very strong bounce against the U.S. dollar, a picture perfect bounce from support. I hope to write more about it in a future post as well as write a long overdue update on trades I have made according to the “commodity crash” playbook. It also looks like I sold those Terex (TEX) puts just in time as well!
At the time of writing, the China GDP numbers are right around the corner. The market behaved today as if it suddenly switch from fear of a Chinese slowdown to breathless anticipation of a Chinese surge. Accordingly, FXI popped to three week highs. I decided to hold onto my FXP shares though even as they flipped from profit to loss in a flash. These flailing emotions about China are soooo fickle…
Charts below are the latest snapshots of T2108 (and the S&P 500)
Refresh browser if the charts are the same as the last T2108 update.
Black line: T2108 (measured on the right); Green line: S&P 500 (for comparative purposes)
Weekly T2108

*All charts created using freestockcharts.com unless otherwise stated
Related links:
The T2108 Resource Page
Expanded daily chart of T2108 versus the S&P 500
Expanded weekly chart of T2108
Be careful out there!
Full disclosure: long SDS; long SSO calls; long VXX puts and calls; long CAT shares and puts; approximately net neutral the Australian dollar in forex, long FXP

