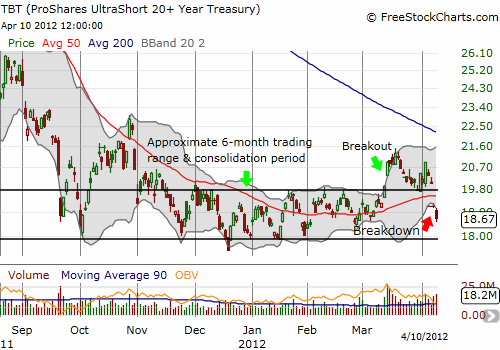
Almost a month ago I made another case for a bottom in TBT, the ProShares UltraShort 20+ Year Treasury. The related breakout include some large, upward one-day moves. The churn included a convincingly successful retest of presumed support at the upper channel that formed the consolidation pattern for TBT’s bottom. Alas, that was not enough to prevent a large gap down on Monday and strong follow-through selling as weakness in the stock market has sent investors scurrying back for the “safety” and comfort of government bonds.

The breakdown essentially converts the previous breakout into a potential false breakout. At the current pace, TBT will not even remain in the consolidation pattern for long.
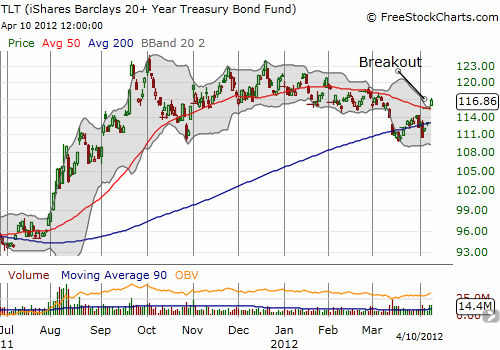
Adding to TBT’s jeopardy is that TLT, the iShares Barclays 20+ Year Treasury Bond Fund, has broken out from what previously appeared to be a topping pattern. Instead, TLT’s 200DMA generally held, and then TLT neatly gapped up above its 50DMA.

Finally, a reader pointed me to a blog called “Equity Clock” that published a seasonality chart for 30-year Treasury Bond Futures. I was amazed to see how regularly the 30-year seems to gain in price from May until the end of the year. Perhaps it is somehow connected to the “sell in May” mantra.
Regardless of the reason for TLT’s resurgence and TBT’s quivering, it is now time to think about what could happen if TBT craters to new lows. I am guessing that will only happen with some extremely dire catalyst in the market.
Be careful out there!
Full disclosure: long TBT shares and calls and short puts
