{3/21 – changed title and link to fix incorrect date and naming format}
(T2108 measures the percentage of stocks trading above their respective 40-day moving averages [DMAs]. To learn more about it, see my T2108 Resource Page. You can follow real-time T2108 commentary on twitter using the #T2108 hashtag. T2108-related trades and other trades are posted on twitter using the #120trade hashtag)
T2108 Status: 65%
VIX Status: 15%
General (Short-term) Trading Call: Hold with a bullish bias (more details below)
Reference Charts (click for view of last 6 months from Stockcharts.com):
S&P 500 or SPY
SDS (ProShares UltraShort S&P500)
U.S. Dollar Index (volatility index)
VIX (volatility index)
VXX (iPath S&P 500 VIX Short-Term Futures ETN)
EWG (iShares MSCI Germany Index Fund)
Commentary
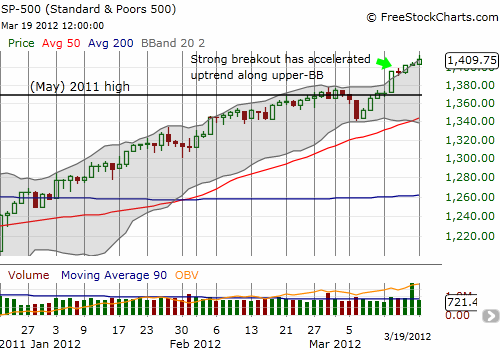
What does it mean for the S&P 500 to trade at multi-year highs, straddling its upper-Bollinger Band, and T2108 still not trigger an overbought signal? I believe it means the firm and aggressive bullish bias is further confirmed. Even though the S&P 500 experienced a weak close, this pullback only returned the index to the magnetic pull of the upper-Bollinger Band. The uptrend in the index has officially accelerated. (Oh, and Apple’s stock closed above $600 in a late run into the close).

Adding further woes to bearish bets is that volatility increased 4% while VXX, the iPath S&P 500 VIX Short-term Futures actually went DOWN 6%. I noted stats on VXX in the last update indicating that the trade is getting very crowded, very fast. These non-stop losses in this awful ETN should eventually lead to some kind of blow-out low, perhaps in parallel with some kind of climactic top in the S&P 500. The bottom it creates for VXX will be just as temporary as the last one, so stay nimble.
Until then, buying dips on individual stocks and indices should continue to pay well.
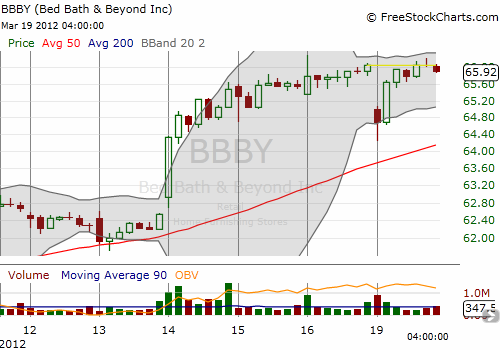
I was looking for an early dip in the S&P 500 to launch into fresh SSO calls. Instead, the S&P 500 stubbornly rallied most of the day. However, Bed Bath & Beyond (BBBY) delivered a great example of my ideal setup during this late bullish phase of the stock market. Unfortunately, I did not trade it because my stingy offer at the bid for the call options never filled.

I use an hourly chart to dramatize how quickly the trade in BBBY unfolded. An analyst downgrade took the stock down at the open after it looked like BBBY would surely make another all-time high. In just three hours, BBBY recovered all its losses, and the trade effectively ended for the day. This setup caught my attention because one analyst’s downgrade is rarely enough to bring such bullishness to an abrupt end. Just three trading days ago, BBBY jumped 4.7% to fresh all-time highs (at that time) on very strong buying volume. Anyone missing this move thinks of any dip as an opportunity to hop on before the train has completely left the station. I can only hope I improve my execution for the next similar setup.
I also mention BBBY because it is a great reminder that retail stocks can still fly despite the headwinds of higher gas prices and on-going fears that a recession looms right around the corner. BBBY is a great segue to its cousin in name, BBY, Best Buy. I will be dedicating a post to BBY’s setup; the company reports earnings next week. BBBY also straddles the housing sector, and I will be posting on KB Home (KBH) ahead of Friday’s earnings. Both BBY and KBH face extremes in negativity that I believe are misplaced given the current trading and investing context; BBY is a legitimate “catch-up” stock while KBH is a stubborn rocket ship. Stay tuned.
Charts below are the latest snapshots of T2108 (and the S&P 500)
Refresh browser if the charts are the same as the last T2108 update.
Black line: T2108 (measured on the right); Green line: S&P 500 (for comparative purposes)
Weekly T2108

*All charts created using freestockcharts.com unless otherwise stated
Related links:
The T2108 Resource Page
Expanded daily chart of T2108 versus the S&P 500
Expanded weekly chart of T2108
Be careful out there!
Full disclosure: long SDS and VXX; long VXX puts; long BBY; long KBH shares, call spread, and puts

