(T2108 measures the percentage of stocks trading above their respective 40-day moving averages [DMAs]. To learn more about it, see my T2108 Resource Page. You can follow real-time T2108 commentary on twitter using the #T2108 hashtag. T2108-related trades and other trades are posted on twitter using the #120trade hashtag)
T2108 Status: 80% (overbought day #35)
VIX Status: 18
General (Short-term) Trading Call: Close more bullish positions. Begin but do NOT expand an existing bearish position.
Reference Charts (click for view of last 6 months from Stockcharts.com):
S&P 500 or SPY
SDS (ProShares UltraShort S&P500)
U.S. Dollar Index (volatility index)
VIX (volatility index)
VXX (iPath S&P 500 VIX Short-Term Futures ETN)
EWG (iShares MSCI Germany Index Fund)
Commentary
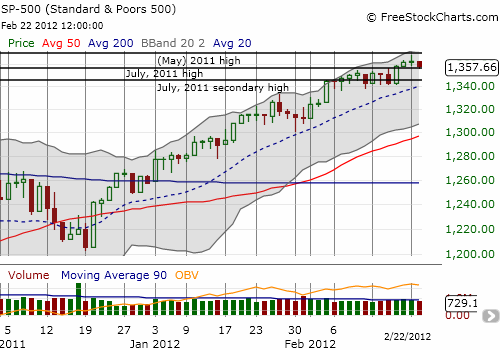
I was ready to rubber stamp in another note about overbought conditions. But today was a LITTLE different in that T2108 actually dropped a healthy chunk of percentage points, from 83% to 80%, although the S&P 500 closed a fraction of a percent. T2108 returns to last Wednesday’s level which was a 1-month low. I would not have thought much of the surprise drop except that the S&P 500 stopped cold right at the 2011 high. Follow-through selling, which has not really happened this entire rally, would confirm a higher likelihood of some kind of top. At a bare minimum, I think this kind of drop in T2108 signals some slowing momentum.
The chart below includes the lines from 2011’s significant highs.

The S&P 500 can drop back to last Wednesday’s level around 1340 and remain firmly within the strong uptrend defined by the 20DMA (dashed line above). In other words, there is very little for bears to chew on, but just enough to make me take note just in case this pattern develops into something more meaningful. Technicians will recognize the close call with an “evening star” candlestick pattern. This pattern typically signals the end of an uptrend.
Charts below are the latest snapshots of T2108 (and the S&P 500)
Refresh browser if the charts are the same as the last T2108 update.
Black line: T2108 (measured on the right); Green line: S&P 500 (for comparative purposes)
Weekly T2108

*All charts created using freestockcharts.com unless otherwise stated
Related links:
The T2108 Resource Page
Expanded daily chart of T2108 versus the S&P 500
Expanded weekly chart of T2108
Be careful out there!
Full disclosure: long SDS and VXX; long VXX puts

