(T2108 measures the percentage of stocks trading above their respective 40-day moving averages [DMAs]. To learn more about it, see my T2108 Resource Page. You can follow real-time T2108 commentary on twitter using the #T2108 hashtag. T2108-related trades and other trades are posted on twitter using the #120trade hashtag)
T2108 Status: 36%
VIX Status: 24
General (Short-term) Trading Call: Hold
Commentary
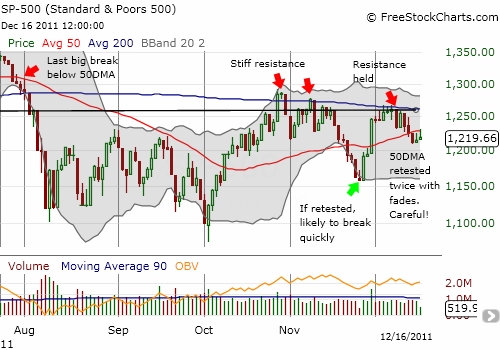
T2108 dropped as low as 28% this week on Wednesday, December 14. The bounce back on the next day gave all the appearances of another “almost oversold” bottom – I even tweeted as much. However, the week has ended on a very mixed note as I will explain below. It also remains important to keep an eye on the big picture: despite all the wild swings, the S&P 500 has gone absolutely nowhere for over 4 months.

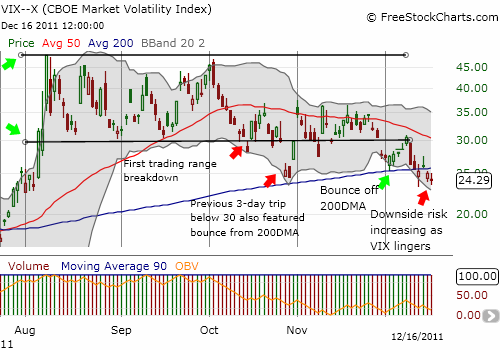
The S&P 500 dropped 3.6% for the week. The three days of selling delivered plenty of bearish signals. The abrupt end to the slide at T2108 = 28% had a familiar vibe. The November lows were abruptly created after T2108 hit 24%. However, in this case, note in the chart above that the S&P 500 did not generate a large comeback rally. Instead, it limped its way into the 50DMA twice and failed to break resistance. This would be extremely bearish behavior under the circumstances EXCEPT the VIX looks ready to breakdown as it has lingered below its 200DMA for three out of the last four days.

In other words, there is enough material here for both bears and bulls to claim the advantage. Even my own T2108 trades are now mixed with my VXX calls expiring without any further fanfare and leaving me with VIX puts married with SDS and VXX shares. With one final week of trading before Christmas, I simply cannot imagine the stock market making any major or meaningful moves. Anything is possible of course, but I will remain relatively passive in trading until 2012. My current bias is for a bearish January. Only more selling in the coming two weeks may change that assessment.
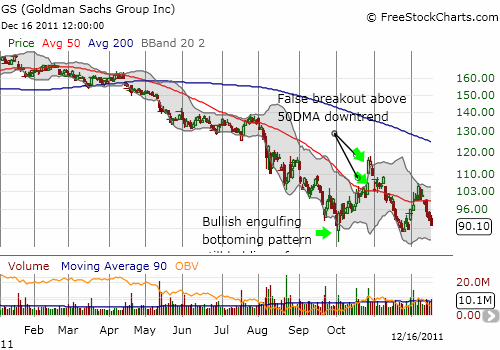
If Goldman Sachs (GS) has its way, it just might try to deliver the drama. GS continued to sell off even after the S&P 500 ended its selling momentum. GS is once again hovering over its 2 1/2 year closing lows. I do not expect this flimsy support to hold.

Charts below are the latest snapshots of T2108 (and the S&P 500)
Refresh browser if the charts are the same as the last T2108 update.
Black line: T2108 (measured on the right); Green line: S&P 500 (for comparative purposes)
Weekly T2108

*All charts created using freestockcharts.com unless otherwise stated
Related links:
The T2108 Resource Page
Expanded daily chart of T2108 versus the S&P 500
Expanded weekly chart of T2108
Be careful out there!
Full disclosure: long SDS and VXX; long VXX calls and puts; net long U.S. dollar; net short euro, long GS shares and put spread

