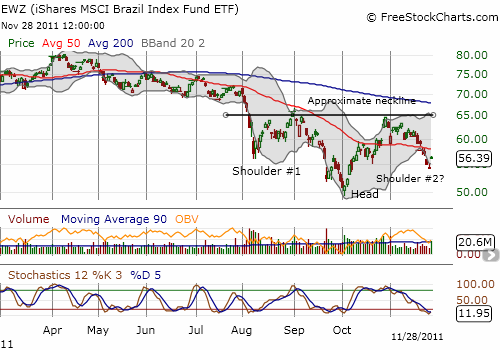
This post is a very belated acknowledgement that EWZ (iShares MSCI Brazil Index Fund ETF) triggered the 20% rule again. As a reminder, (with a few exceptions) I have been buying EWZ whenever it trades 20% of its recent highs. For example, this rule triggered a purchase in early August; see “Commodities Crash’ Triggers First Trades – ANR and EWZ.” EWZ’s 52-week high is $80, making $60 the magic number.
I have successfully traded in and out of EWZ twice, and perhaps the third time can be a charm (and not the punishment for pushing my luck!). EWZ hit $60 for a third time in as many months on November 17 as the index hovered above its 50DMA. I was fortunate to have my mind focused on other things as EWZ went on to lose another 10% before bouncing 3.9% on Monday. The 20% rule trumps the bearish technicals of trading below a declining 50DMA. Moreover, EWZ’s chart features an interesting, and rare, development: the formation of a potential inverse head and shoulders. This pattern is a bullish indicator of a potential bottom. It is confirmed once EWZ breaks out above the neckline. EWZ is also short-term oversold given its stochastics – exactly where it was at its 52-week lows.

Source: FreeStockCharts.com
I will nibble on a small position on Tuesday. I am remaining cautious given my overall short-term bearish outlook on the stock market. I will save some powder for potentially adding to my position at lower prices.
Be careful out there!
Full disclosure: no positions
