(T2108 measures the percentage of stocks trading above their respective 40-day moving averages [DMAs]. To learn more about it, see my T2108 Resource Page. You can follow real-time T2108 commentary on twitter using the #T2108 hashtag.)
T2108 Status: 53%
VIX Status: 31
General (Short-term) Trading Call: Hold.
Commentary
The bullish vibes continue in the stock market as T2108 jumped to 53%, and the S&P 500 gained 1%. The VIX closed at 31 after falling as low as 30. VXX, the iPath S&P 500 VIX Short-Term Futures ETN, dropped another 7%. Its primary uptrend has ended, and it is now testing its 50DMA. (As usual, click links on symbols to review their charts).
What does all this mean today? The stock market is just one more push away from a major breakout:
- The S&P 500 is just below the top of its trading range. The high of the day stopped exactly at the top of the range at 1220. A strong CLOSE above today’s high will mark a breakout.
- The VIX is just above the bottom of its trading range. The low of the day stopped exactly at the bottom of the range at 30. A close below 30 will end a 2 1/2 month trading range and signal a rapid end to this period of high volatility.
- The VXX bounced slightly off its 50DMA. The primary uptrend ended Monday. A CLOSE below the 50DMA will signal a rapid resumption of VXX’s normal pattern of continuous losses.
I wish I had not sold my VXX puts last week in thinking that the uptrend would hold up once again. However, I remain positioned heavily bullish. If the stock market can get just one more push and close above the 2 1/2 month trading range, I will assume that T2108 will next hit overbought levels (70% and above) before dropping to oversold levels. Such an event would likely occur just as the S&P 500 rises to meet its next challenge: a retest of the 200DMA around 1275.
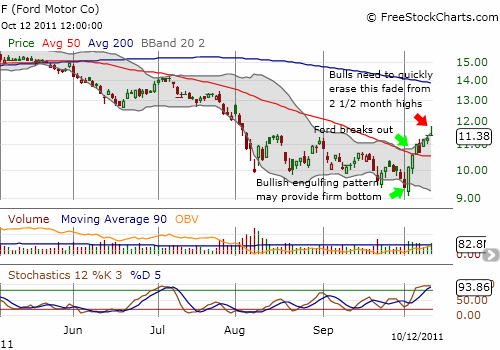
I end with one chart: Ford Motor Company (F). A week ago on October 5th, I tweeted the following: “Bought $F calls on news Moody’s is reviewing for possible upgrade. This is a non-recessionary signal. #120trade.” I went for January calls and found them incredibly cheap. The next day, Ford’s stock broke out above the 50DMA and has not stopped since. Today, the stock printed a 2-month high before getting pushed back to resistance. I consider the action here to be one of many pivotal battlegrounds that will demonstrate whether the market continues to anticipate recession or has begun to anticipate recovery. The onus remains on the bulls.
Two additional notes on Ford’s chart: 1) the stochastics are now overbought; 2) the presumed bottom on October 4th is very convincing with a high-volume bullish engulfing pattern.

Source: FreeStockCharts.com
Charts below are the latest snapshots of T2108 (and the S&P 500)
Refresh browser if the charts are the same as the last T2108 update.
Black line: T2108 (measured on the right); Green line: S&P 500 (for comparative purposes)
Weekly T2108

*T2108 charts created using freestockcharts.com
Related links:
The T2108 Resource Page
Expanded daily chart of T2108 versus the S&P 500
Expanded weekly chart of T2108
Be careful out there!
Full disclosure: long SSO

