(T2108 measures the percentage of stocks trading above their respective 40-day moving averages [DMAs]. To learn more about it, see my T2108 Resource Page. You can follow real-time T2108 commentary on twitter using the #T2108 hashtag.)
T2108 Status: 41% (UP 20 percentage points!!!)
VIX Status: 33 (FINALLY drops below its 50DMA!)
General (Short-term) Trading Call: Hold.
Commentary
I used exclamation points in today’s statistical summary for a very good reason. Today was a VERY bullish day. Last week’s converging bullish signals are now exploding to the upside. I did not think that we could learn much from the market’s technicals while it remained within the previous trading range, but today could prove me pleasantly wrong.
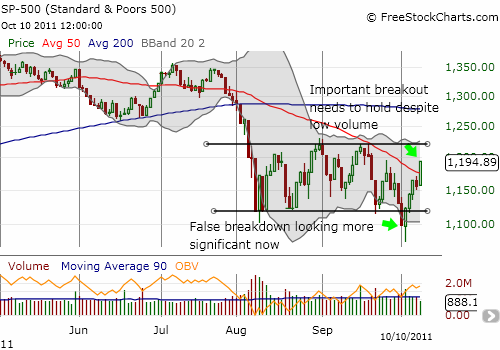
T2108 closed at 41%, up an amazing 17 percentage points. This equals an incredible 88% jump. In other words, a massive group of stocks likely hurdled over significant technical resistance today. In parallel, the VIX FINALLY dropped below its 50DMA which had previously supported the stubborn rise of the VIX. Finally, adding an exclamation point is the S&P 500 itself with a 3.4% gain that catapulted it above the 50DMA. (As always, click links to see related charts).
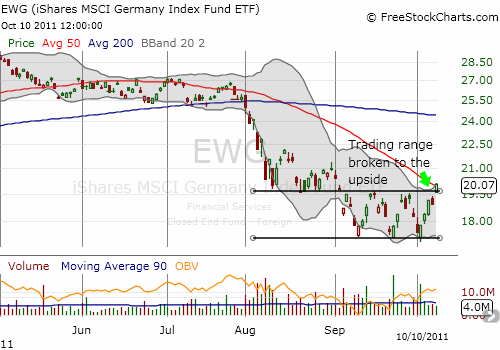
Almost a month ago, I purchased European shares to make a play on 2 1/2 year lows and major oversold conditions in European markets. I went for Germany, given its dominant strength in Europe, buying the the iShares MSCI Germany Index Fund ETF (EWG) and Siemens Atkins (SI). I sold SI on the first bounce, but kept EWG. EWG declined two more times to retest its lows. While I do not believe in triple bottoms, EWG is making a convincing case by closing over its 50DMA and breaking the previous trading range to the upside.

Siemens (SI) experienced a very similar breakthrough.
What could possibly go wrong now? I think there are three caveats to keep in mind.
First, the VIX did not break below its trading range yet. I will interpret such a breakdown as a major bullish confirming signal. Until then, caution must still prevail.
Second, recall that the S&P 500’s trading range broke to the DOWNSIDE only to have buyers take rally the market swiftly out of the chasm. While that rally continues, sellers could certainly return the favor by bringing out the skeptical firepower to push the market back below the important technical lines of resistance that should now serve as support.
Finally, volume on the S&P 500 was poor. Doug Kass tweeted the following statistics: “Light volume:: note: NYSE -27%, -23%, -24% vs 10, 20, 30 day avgs.” This partially explains why he chose yet again to fade the rally although his current price targets have the market closing the year higher than current levels. (Yes, he can seem quite schizophrenic at times, but his “madness” will work as long as the index keeps bouncing in a trading range). The buying volume on the S&P 500 was the lowest since September 15 when the index’s last big rally stalled. On a major up-day like today, buying volume should be a lot stronger. However, reading too much into trading volume has been a losing strategy ever since the March, 2009 lows – relatively low buying volume has been a stock market staple for a few years now.

Charts below are the latest snapshots of T2108 (and the S&P 500)
Refresh browser if the charts are the same as the last T2108 update.
Black line: T2108 (measured on the right); Green line: S&P 500 (for comparative purposes)
Weekly T2108

*T2108 charts created using freestockcharts.com
Related links:
The T2108 Resource Page
Expanded daily chart of T2108 versus the S&P 500
Expanded weekly chart of T2108
Be careful out there!
Full disclosure: long SSO, long EWG

