(T2108 measures the percentage of stocks trading above their respective 40-day moving averages [DMAs]. To learn more about it, see my T2108 Resource Page. You can follow real-time T2108 commentary on twitter using the #T2108 hashtag.)
T2108 Status: 17% (Day #14 of the current oversold period).
VIX Status: 36
General (Short-term) Trading Call: Only add to bullish positions on dips. Hold any remaining bearish positions as small hedges.
Commentary
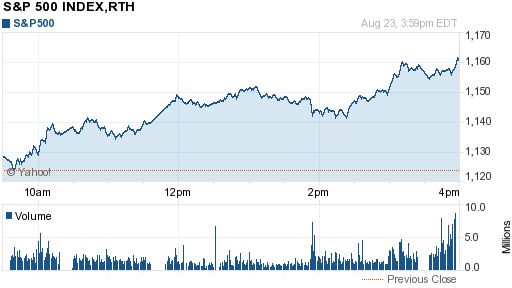
Today’s rally had one feature that I particularly liked: a slow melt-up. The open was deceptively tame and directionless with all the feel of a market setting up for a fresh round of selling. Instead, buyers stepped up and pressed the pedal to the metal firmly into the close. The S&P 500 closed up 3.4%, but the upside momentum stalled at enough points in the day to catch (I am sure) plenty of bears leaning the wrong way before sweeping higher again.

Source: Yahoo!Finance
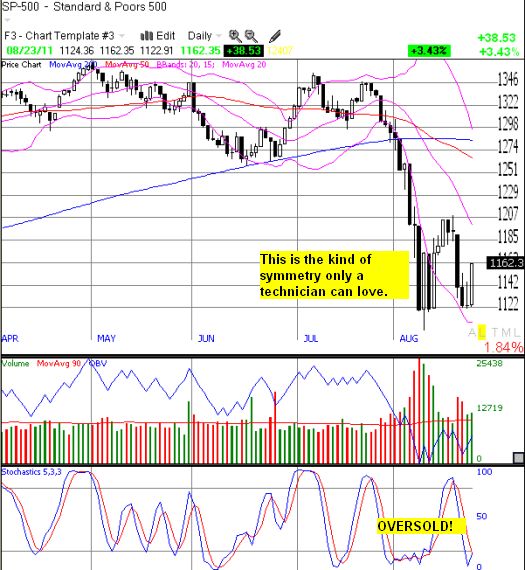
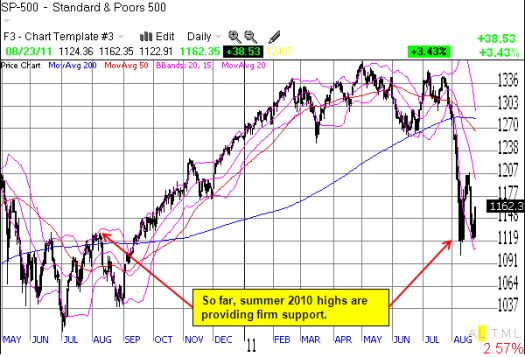
Note that this bounce occurred, once again, off the 1120-1122 level. This tight range has served as firm support throughout the August swoon with a perfect symmetry that you just cannot make up. And why is this number so magical anyway? Well, because it represents the highs from LAST summer of course!


With this support holding so firmly and perfectly for seven recent trading days, it has become an “obvious” decision point. Either market manipulators, uh, makers and trading bots are going to attempt to jam the market lower to take out all the stops resting just beneath these lows, and/or the market guns ever higher, including a gap up as soon as Wednesday morning to put an exclamation point on this bottom. Since the stock market is in oversold territory (note above that even the stochastics are now very oversold), my bias is of course with the latter scenario. (As a reminder, see my revised trading rules for dealing with the potential of a break of the 2011 lows).
At 17%, T2108 is just one good up-day away from finally exiting oversold territory. With so many 40DMAs sloping downward, T2108 approaches this borderline at a lower point on the S&P 500 than last week’s close call when T2108 hit 19% at the end of a 3-day rally. That high from last week will serve as natural resistance for any ensuing rally.
Those of you planning to make some sales on this second trip up, will probably not lock in as much profit as you had last week. Be grateful nonetheless because this kind of trading is NOT easy – just a reminder in case you have not yet noticed! For those of you like me who have sights set a little further out (like a retest of the 50DMA and/or the next overbought juncture), prepare for a bumpy ride through tough resistance. As I have said before, every rung up the ladder from here will provide selling opportunities for relieved and anxious traders and investors.
I was again light on the T2108-related trades today. I added to my growing collection of VXX puts (see my twitter feed). VXX only declined 4.8% while the VIX dropped 14.5%. I also trimmed some of my holdings in Goldcorp (GG) which is part of my overall strategy of investing in gold: core holding in GLD, trading positions in gold miners. The same strategy holds with silver.
Charts below are the latest snapshots of T2108 (and the S&P 500)
Refresh browser if the charts are the same as the last T2108 update.
Daily T2108 vs the S&P 500

Black line: T2108 (measured on the right); Red line: S&P 500 (for comparative purposes)
Weekly T2108

*All charts created using TeleChart:

Related links:
The T2108 Resource Page
Expanded daily chart of T2108 versus the S&P 500
Expanded weekly chart of T2108
Be careful out there!
Full disclosure: long shares and calls on SSO, long VXX puts
