(T2108 measures the percentage of stocks trading above their respective 40-day moving averages [DMAs]. To learn more about it, see my T2108 Resource Page.)
T2108 Status: 26%.
VIX Status: 23.4
General (Short-term) Trading Call: Continue closing out bearish positions. Maintain list of bullish trades.
Commentary
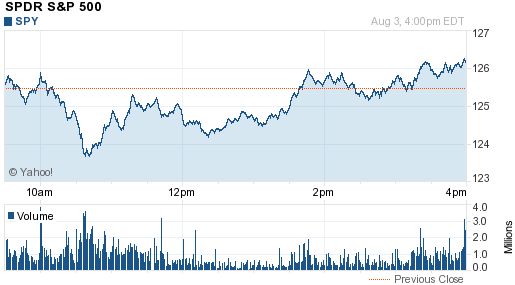
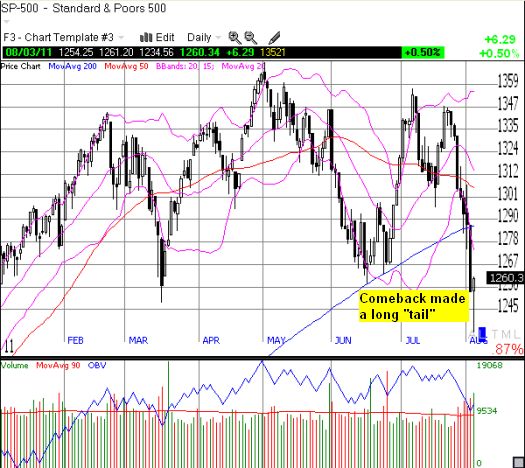
Today was one of those days I wish T2108 reported intraday levels. I just happened to note T2108 drop exactly to 20% right before noon Eastern. Given this check was shortly after the S&P 500’s first intraday bounce of the day, I suspect that T2108 was even lower when the S&P 500 hit bottom at 10:30am Eastern. Instead of seeing this dramatic turn of events, the T2108 chart simply shows that the indicator increased slightly by two percentage points to 26%. Technically, we got our oversold signal, even if it lasted all of a few hours. I have this fact in the back of my mind as I draw conclusions from today’s action.
The most intriguing characteristic of today’s trading is that the S&P 500 set a new intraday low of the year, yet, the volatility index, the VIX, did not make a new high for this trading cycle. It stopped short of the intraday highs printed on July 31 and Aug 1 (click here for the current chart of the VIX posted at stockcharts.com). So, once again, I am very hesitant to declare that it is time to buy. The only moves I made were to add another put on VXX and buy shares in Graftech Intl Ltd (GTI). GTI has been on my “buy on a plunge” list for a while now given bullish things I have read on the graphite business. To manage potential upside risks, traders should continue to close out bearish positions. For example, I sold the rest of my “stand alone” SSO puts today, but I am still holding my spreads.
The CBOE equity put/call ratio further bolsters my skepticism that the stock market has achieved a bottom for this cycle. Yesterday, I flagged this indicator for the first time in the hopes of providing further clarity on whether the weak showing of the VIX and the strong selling produced a bearish divergence. Today’s action confirmed the bearish divergence. And, sure enough, the CBOE equity put/call ratio DECLINED yesterday even as the S&P 500 plunged to a closing low for the year and broke the 200DMA! The ratio dropped from 0.77 to 0.69. This means the number of calls went up relative to puts; that is, it seems traders are rushing to play a bottom.
The rush to play a bottom can now also be seen in today’s action on the S&P 500. The index took another deep plunge almost as large as Tuesday’s. The intraday chart on SPY shows how volume surged at the bottom around 10:30am Eastern, putting an end to the dominance of sellers and setting the stage for a long comeback (Yahoo Finance’s intraday chart of the S&P 500 contains charting errors):

Source: Yahoo! Finance
The bad aspect of this comeback is that it took a LOT of buying interest to accomplish it. These “long tails” rarely hold up as buying power quickly dries up, and sellers regroup and look to fade prices. Even if the market does not quickly reverse this comeback, I am extremely skeptical there will be enough buying power to break above the 200DMA before T2108 returns to (or close to) oversold levels. Again, supporting my skepticism is the relative lack of fear shown in the VIX and the CBOE equity put/call ratio. (Note well that my old study on the VIX vs T2108 showed a poor correlation between bottoms for T2108 and highs for the VIX for a given oversold trading cycle).

In summary, the T2108 rules indicate that the market has likely reached a bottom given it got to oversold levels with the VIX higher than the previous oversold period in June. The market even plunged well below important support at the same time which I was looking to provide a major buying signal. However, I have lingering doubts because the market is not yet showing the level of fear I would have expected at this juncture. Given this hesitation, I am maintaining a balanced outlook to continue closing out a few bearish positions, and only adding to VXX puts as a bullish play. My skepticism toward the bullish side will not recede for this cycle until the S&P 500 closes back above the 200DMA…OR T2108 closes at or below 20%.
Charts below are the latest snapshots of T2108 (and the S&P 500)
Refresh browser if the charts are the same as the last T2108 update.
Daily T2108 vs the S&P 500

Black line: T2108 (measured on the right); Red line: S&P 500 (for comparative purposes)
Weekly T2108

*All charts created using TeleChart:

Related links:
The T2108 Resource Page
Expanded daily chart of T2108 versus the S&P 500
Expanded weekly chart of T2108
Be careful out there!
Full disclosure: long puts on SSO and VXX

Hi, What level on the VIX would constitute a buy signal for you, if any? I’ve read that below 23 could work. What do you think of that?
Thanks!
That’s interesting. I would rather look for a close above the 200DMA on the S&P 500 than a VIX close below 23. The VIX has yet to spike to extremes, so I am not sure how a close below 23 is all that meaningful. In fact, I would prefer to buy if the VIX spike even higher, say, a 15-20% move…assuming T2108 dropped to 20% or lower at the same time of course!