(T2108 measures the percentage of stocks trading above their respective 40-day moving averages [DMAs]. To learn more about it, see my T2108 Resource Page.)
T2108 Status: 29% and neutral.
VIX Status: 19.
General (Short-term) Trading Call: Hold.
Commentary
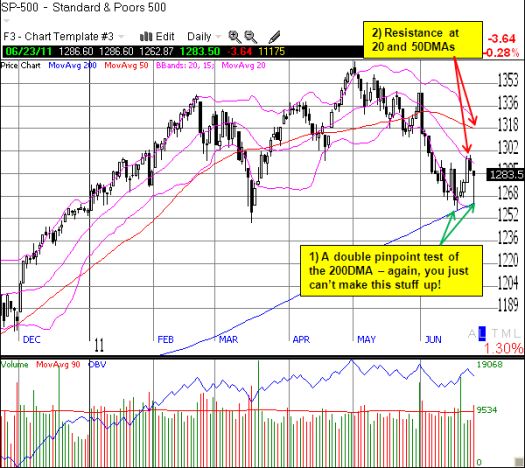
If you only looked at the final tally, you would miss 90% of the story in today’s trading. You might also think that today’s action confirmed yesterday’s expectation that nothing much had changed. T2108 lost a mere percentage point and closed at 29%. The S&P 500 closed essentially flat. Yet, at the lows, T2108 dropped to at least 24% (I checked intraday values but the chart only shows closing values), and the S&P 500 had lost almost 2%. For the second time in six days, the index managed to perform a pinpoint bounce from the 200DMA. A truly amazing performance that reminds us of the power of oversold conditions. For today, it helped to remember that the market had just bounced from oversold conditions and was stretching the rubber band yet again.

Today had all the feel of a second washout of sellers. However, long “tails” such as the one above are hard to sustain without some more pushback. I will call it a stalemate between bears and bulls where critical proof rests on the clear supports at the 200DMA and lows for the year and the resistance levels seen in the chart above.
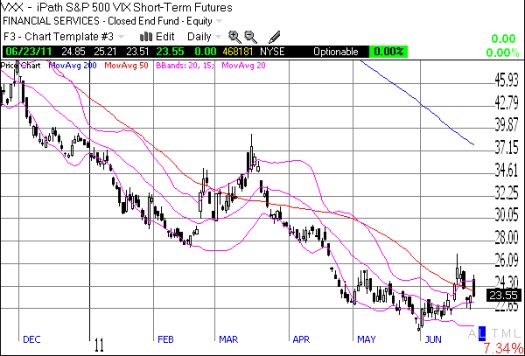
As I mentioned earlier this week, my observation of stark divergences in the performance of individual stocks during the bounce from oversold conditions has focused more of my attention on indices. Today, I added another tool to the toolkit: VXX, the iPath S&P 500 VIX Short-Term Futures. This index product wastes away faster than a half-eaten peach in the hot Georgia sun (see “VXX Calculations, VIX Futures and Time Decay” for more), so it makes for a particularly good short when volatility spikes higher. As VXX reached what ended up being the high for the day, I reached for July $23 puts. So far, so good.

The volatility index revisited levels seen during the recent oversold period without T2108 getting oversold again. I believe this is a bullish divergence… and it should get tested or confirmed very quickly.
Charts below are the latest snapshots of T2108 (and the S&P 500)
Refresh browser if the charts are the same as the last T2108 update.
Daily T2108 vs the S&P 500

Black line: T2108 (measured on the right); Red line: S&P 500 (for comparative purposes)
Weekly T2108

*All charts created using TeleChart:

Related links:
The T2108 Resource Page
Expanded daily chart of T2108 versus the S&P 500
Expanded weekly chart of T2108
Be careful out there!
Full disclosure: long SSO puts, long VXX puts
