
(T2108 measures the percentage of stocks trading above their respective 40-day moving averages [DMAs]. To learn more about it, see my T2108 Resource Page.)
T2108 Status: 62% and Neutral.
General Trading Call: Hold.
Commentary
T2108 jumped to 62%, firmly confirming that the downward cycle for T2108 has ended. T2108 dipped into my downside target of 30-40% for only a day for the last cycle. I place the blame solidly at the doorstep of the pesky U.S. dollar which sold off for the 4th day out of the last 5. Weakness in the dollar is once again correlated with stock market strength. With the dollar index back below the 50DMA, it is even more likely now this momentum will continue.
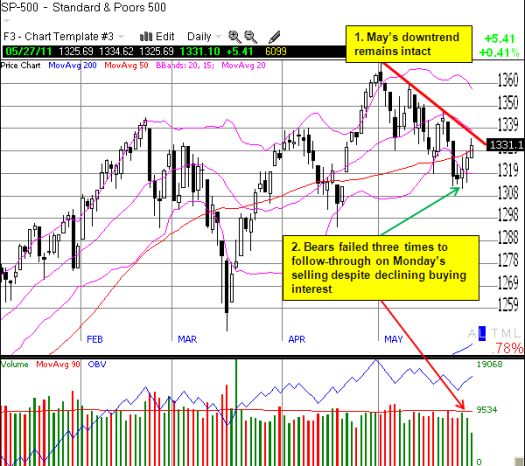
The S&P 500 also made an important milestone by breaking out of May’s short-term downtrend. I had expected selling today followed by a rally to start the month of June. Instead, I now have to project a continuation of the trend breakout that will take the S&P 500 back into overbought territory within a week. Such a move should also feature a retest of the 52-week high.
With T2108 at 61%, I am more interested in identifying longs I want to sell into this rally rather than loading up on fresh longs. I am even more interested in initiating fresh shorts once (if?) T2108 gets back into overbought territory.
June could be a very eventful month with a LOT of macro-economic and geo-political news ahead. I will soon post my latest installment of “fun with numbers” that shows that the S&P 500’s performance during the summer is typically positive, even when the market sells off in May as it did this year. This performance is contrary to popular belief that stems from the “Sell in May” adage and the assumption that trading in the summer is sluggish, poorly attended, and uneventful.
Needless to say, I am expecting fireworks for the summer from beginning to end.
Charts below are the latest snapshots of T2108 (and the S&P 500)
Refresh browser if the charts are the same as the last T2108 update.
Daily T2108 vs the S&P 500
")
Black line: T2108 (measured on the right); Red line: S&P 500 (for comparative purposes)
Weekly T2108

*All charts created using TeleChart:

Related links:
The T2108 Resource Page
Expanded daily chart of T2108 versus the S&P 500
Expanded weekly chart of T2108
Be careful out there!
Full disclosure: long SSO puts