(T2108 measures the percentage of stocks trading above their respective 40-day moving averages [DMAs]. To learn more about it, see my T2108 Resource Page.)
T2108 Status: 41% and Neutral
General Trading Call: Hold.
Commentary
T2108 drifted upward to 41% and out of my downside target range of 30-40%. While my bias remains that this trading cycle will end with T2108 entering the bottom of this range, I must take into account the possibility that this rise, marginal as it is, has already signaled the lows for this cycle. In fact, as I write, Asian stock markets opened sharply higher, and the U.S. dollar is selling off.
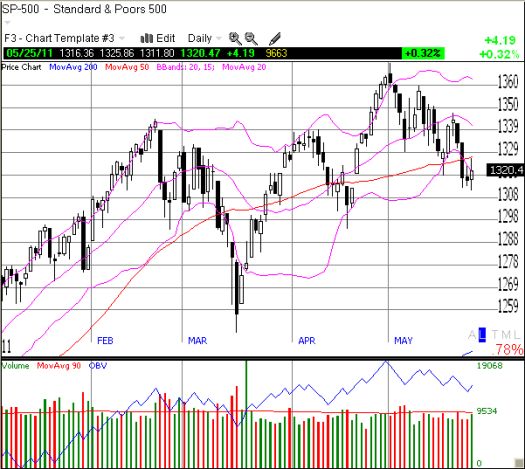
The S&P 500 reminded us why and how technicals matter, especially in the short-term. After plumbing the lows of the month again, and failing again to follow-through on Monday’s big sell-off, the S&P 500 made a rush for the 50DMA and stopped cold. I am posting the chart this time given the fascinating churn we have seen these past few days.

*Chart created using TeleChart:

Notice that the S&P 500 could rally back to 1334 or so and still remain within the current downtrend. This level would be Monday’s high, so, I will not be surprised if we get such a rally by Friday before sellers return to close out positions ahead of the holiday weekend.
The trading call is hold given the balance of up and downside risks (I love Fed-speak!)
Charts below are the latest snapshots of T2108 (and the S&P 500)
Refresh browser if the charts are the same as the last T2108 update.
Daily T2108 vs the S&P 500

Black line: T2108 (measured on the right); Red line: S&P 500 (for comparative purposes)
Weekly T2108

*All charts created using TeleChart:

Related links:
The T2108 Resource Page
Expanded daily chart of T2108 versus the S&P 500
Expanded weekly chart of T2108
Be careful out there!
Full disclosure: long SSO puts, net short U.S. dollar
