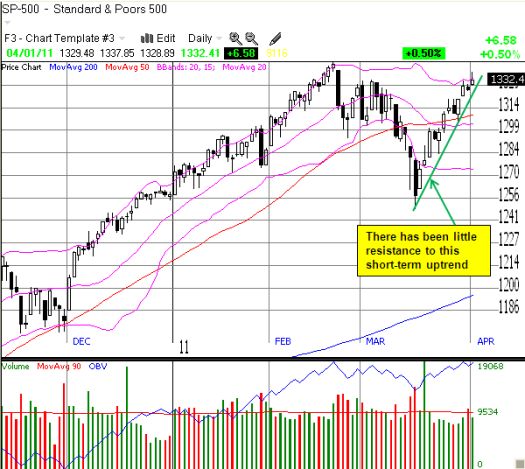
The S&P 500 has rebounded sharply from its March lows with a 6% gain in a little over two weeks. The short-term uptrend has met very little resistance as buyers have interpreted the recent sell-off as an opportunity to accumulate shares.

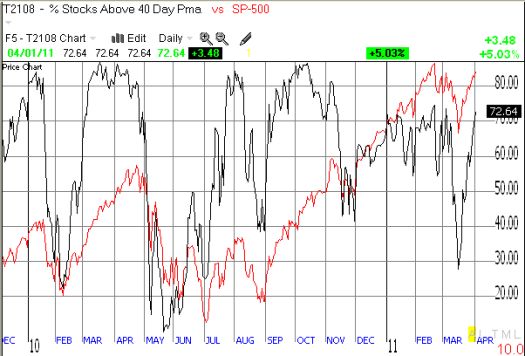
This move has also flipped T2108, the percentage of stocks trading above their 40-day moving averages (DMAs), above the overbought threshold of 70% to 73%. T2108 is now just below 2011’s high of 75% set at the S&P 500’s 31-month high.

*All charts created using TeleChart:

While marginal overbought conditions have preceded bouts of selling this year (the red line above is the S&P 500), the current uptrend keeps the bulls in charge. Shorts on a break of trend will still have to contend with the 50DMA which will likely serve as solid support again. Of course, with earnings season around the corner and Ben Bernanke getting ready to do press conferences like some of his central banking counterparts, traders should stay on their toes.
Be careful out there!
Full disclosure: long SSO puts
