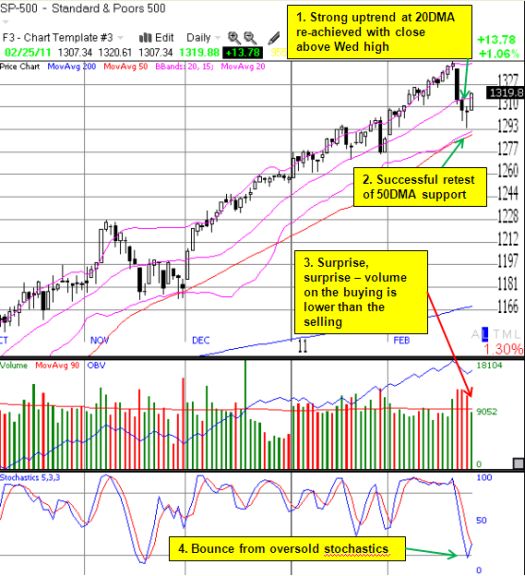
The stock market printed a timely and picture-perfect bounce on Friday. Ahead of the rally, I presented the relatively strong case for the bulls based on the previous 3-day pullback. By closing above Wednesday’s high of 1318, the S&P 500 is also poised to continue its gains.

However, looking beyond this bounce from support, the risks loom larger than ever with higher oil prices threatening to re-introduce the planet to recession. Since reading the Bank of Canada’s base case for $95/barrel oil through 2012, I had tempered my bullishness on oil. The current turmoil complicates the analysis: a surge in oil prices is almost certain to produce a subsequent plunge after the planet chokes on the higher prices. When oil spiked from 2007 to 2008, the economy was in a much stronger position than it is now. So, I have to imagine a crisis-driven oil spike will be shorter-lived, even if the spike is sharper and steeper.
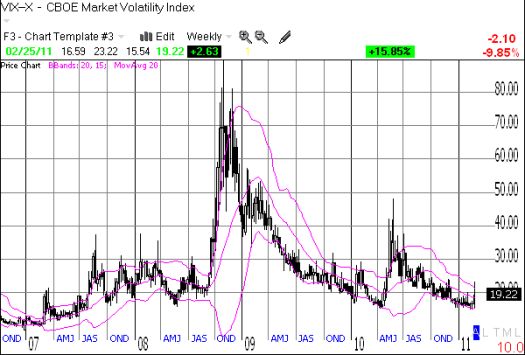
The resulting volatility in such an environment sure makes the volatility index look exceptionally undervalued, especially with the 2008 and 2010 lows in the VIX stubbornly holding since December. (Bill Luby at “VIX and More” posts some reference articles ahead of providing readers some sage observations on the current situation).

*All charts created using TeleChart:

I also expect bullish and bearish cross-currents to cause all sorts of churn and contradictory interpretations of market action. For example, I have found two equally plausible interpretations of commitments to the stock market by individual investors.
Options guru Bernie Schaeffer interprets the under-investment of retail investors in the stock market as a contrarian indicator. The bull market has plenty of room to run since individual investors have only allotted 37% of assets to the stock market whereas 50% and above is more typical. Current levels are even at generational lows. Of course, this means all the selling individual investors have been doing for almost four years has created sustained and persistent generational lows.
On the other hand, Jason Zweig at the WSJ’s Intelligent Investor looks at the numbers and interprets the recent move of individuals to lift off these “generational lows” as a bearish indicator that a top is forming. Zweig focuses in on investors who sold out around the lows in 2008 and 2009 who are just now returning to the stock market.
We can only guess how these cross-currents will resolve themselves in the stock market, but I suspect higher oil prices will significantly slow, if not completely halt, the flow of funds from individual investors into the stock market.
In the meantime, T2108, the percentage of stocks trading above their 40DMAs, has quickly bounced from 3-month highs to 2011 lows and right back to 65.5%, just under the 70% overbought threshold. Another push into overbought territory should generate increased interest from bears and shorts…and the volatility index will probably push lower making out-of-the-money puts extremely attractive.
Be careful out there!
Full disclosure: long VXX
