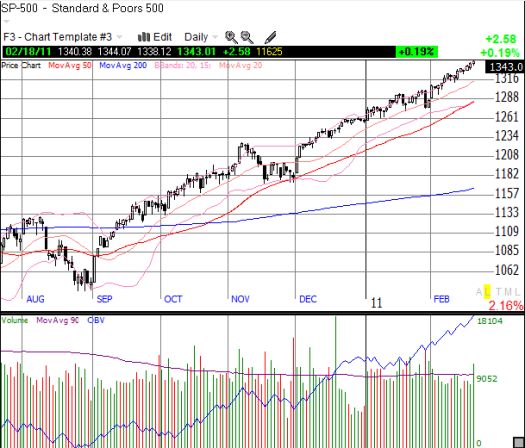
T2108, the percentage of stocks trading above their respective 40-day moving averages (DMAs), has finally moved higher. For much of 2011, T2108 has lingered just above or just below the overbought threshold of 70% (see my new T2108 resource page). It is now at 74.6%. The last time T2108 was this high was 3 months ago in mid-November when the S&P 500 looked like it was topping out at the April, 2010 and 52-week high. This seems like as good a time to reload on downside protection and buy puts on SSO, the ProShares Ultra S&P 500.
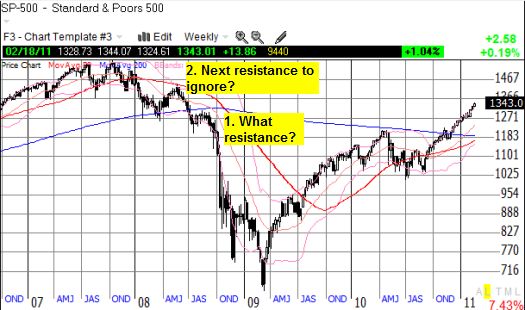
The current rally has been truly remarkable. It easily surpassed the presumed top for the year of 1300-1310. In fact, the S&P 500 plowed right through that resistance level as if it did not exist. But even more remarkable about this rally is its absolute refusal to take even the most basic “rest.”
For example, 2011 has had 34 trading days. Of those 34 days, only 11 have been down days. More importantly, only TWO of those 11 down days closed near the lows of the day. Those days were the two largest down days of the year: Jan 19 closed down 1.0% and Jan 28 closed down 1.8%. One up day, Jan 21, closed near the lows of the day. So, for 31 of 34 trading days this year, buyers have stepped in when the market has either gapped down or traded down from the open. I do not have a historical comparison for context, but this kind of bullish performance seems pretty extreme to me. Dare I say, it even feels orchestrated? Maybe it is just the contact high from the smell of freshly minted U.S. dollars every morning.
Regardless, if we had not just experienced financial and economic calamity a mere two years ago, I think many market observers would be considering reaching for the “bubble” word to describe the stock market’s behavior. However, with a Federal Reserve that still frets about deflation, such talk will have to wait until the index can at least push past all-time highs. At the current breakneck pace of 2.5 average index points per day, the S&P 500 will retest those highs in just another 88 trading days, late June, 2011. For giggles, even if we insert a correction or two, the index could retest all-time highs by year-end…again, at the current pace.
The next strong resistance level for the S&P 500 is not until 1400-1440, the highs from May, 2008. The S&P 500 is already up 5.7% for the year. A challenge of the next resistance level takes the index to an 11% return on the year. I cannot even calculate that high for 2011 yet even if the current pace of trading suggests such a climb is just chump change.


*All charts created using TeleChart:

In 2007, I thought I would never see a stock market crash that would erase almost 60% of value in the United States. In 2009, I thought I would not see a doubling in the stock market for many, many, and many more years. And yet, here we are…surely, anything is possible.
Be careful out there!
Full disclosure: long SSO puts

There are two concepts here
1. The bigger they are the harder they fall!
2. Might over Right
these two concepts are diametrically opposed!
But – due diligence requires the trader to take the chance with lots of controls – stops, etc.
I like that breakdown! I also agree on the approach traders must take.