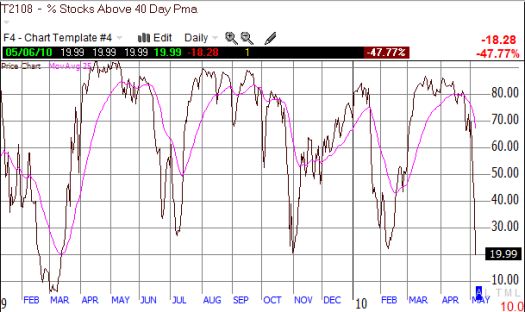
I posted a note before noon on Thursday outlining the latest technicals that seemed to point toward a lower stock market. Almost as soon as I sent it, I wished I had waited…mainly because T2108, the percentage of stocks trading above their 40-day moving averages, started declining at an even faster rate. By the close of trading, T2108 hit exactly 19.99%. The stock market is considered oversold when this indicator reaches 20% or below. Incredibly, this is the first time since the March 2009 lows that the market closed at this oversold level.

*All charts created using TeleChart:

Note carefully that this milestone is also significant because it marks a lower low on T2108. The last rally started with a marginally higher low and ended with a marginally higher high, but I think the overall momentum points downward for this indicator – meaning that even after this oversold period ends, we should expect future oversold periods featuring even more intense selling pressure.
In the meantime, looking for short-term bargains makes sense. With the VIX (the volatilty index) spiking as much as 63% Thursday, the case becomes even stronger for buying into oversold conditions (click here for my post explaining how T2108 and the VIX suggested a bottom was in store in February), but the wonderful wall of worry that bulls love to climb has suddenly become slippery with Greece (yes, bad pun intended). Shorts and sellers will now get VERY active at key points of overhead resistance. The market is not likely to lift ever higher on vapor-thin volumes for quite some time now.
Be careful out there!
Full disclosure: no positions
