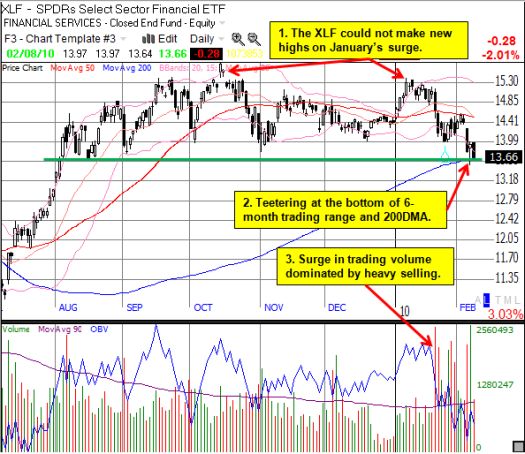
Financial stocks as a group topped in October. The recent surge in selling volume on XLF, the Financial Select Sector SPDR, has dragged prices to a critical support level. The chart below shows the XLF is teetering on the edge of a 6-month trading range. XLF is also testing its 200-day moving average (DMA) (this is the first test of the 200DMA as support since 2007!).
A break below these support levels could be the catalyst that sends the VIX spiking again and T2108 (the percentage of stocks trading above their 40DMA) plunging below its 20% oversold threshold (as discussed here). Of course, a successful test of support should be considered a very bullish sign – at least for the short-term.

*Chart created using TeleChart:

Financials have come into the crosshairs of negative sentiment as the U.S. government moves to join other nations like the United Kingdom in corralling the banking sector. Sovereign debt issues and a stubbornly moribund non-residential real estate sector are no doubt adding intense pressure to the shares of financial companies.
Be careful out there!
Full disclosure: no positions
