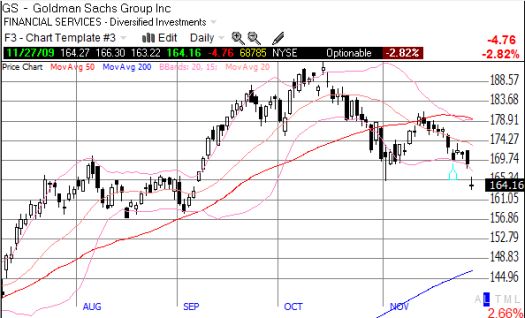
While Friday’s Dubai-related selling left the S&P 500 flat for the last two weeks, Goldman Sachs (GS) dropped almost 3% and punched a new low for November (see chart below). This new low now places GS in its first short-term downtrend since February/March, and it marks a serious failure from the 50DMA resistance. This downturn seems likely to lead the rest of the market downward now that a catalyst has appeared on the horizon to motivate sellers.
More specifically, a catalyst has appeared to drive traders back into the dollar, squeeze the crowd shorting the dollar, and translate the inverse correlation between the U.S. dollar and the U.S. stock market into a market correction. For now, there is no way to even guess how long the markets will even care about the Dubai debacle but this episode could bring some amount of risk aversion back into the market for a sustained period. (I am not sure that any currency deserves “safety” status given that the planet is awash in paper currency and most governments covet a weaker currency, but market psychology is what it is.)
I wrote a more detailed technical analysis on GS a week ago pointing out its ominous stock chart (click here). Perhaps that pattern was a “tell” on what was to come. Regardless, it is now official: GS has broken down. Recapturing the 50DMA, above $180 or so, will nullify the current downtrend. Also, watch for gap traders to buy into GS this coming week before the downtrend resumes.

*Chart created using TeleChart:

Be careful out there!
Full disclosure: long puts on SSO

1 thought on “Goldman Sachs (Stock) Breaks Down”