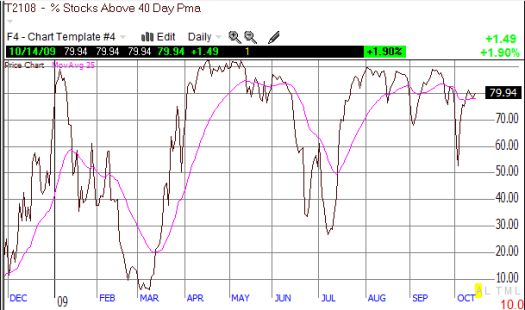
I have not reviewed T2108, the percentage of stocks trading above their 40-day moving average (DMA), or its close cousin T2107, the percentage of stocks trading above their 200-day moving average, since late April (click here for the review). For most of the intervening weeks and months, the message has remained the same: over-bought and strong uptrend. With the Dow Jones Industrials now back above 10,000 for the third time (version 3.0) in 10 years, I decided to honor the occasion by finally posting another review of T2108 and T2107. The chart below shows that T2108 has stayed above 70% for most of the rally off the March lows, indicating persistent over-bought conditions.

For 51 days, between April 1 and June 12, 2009, T2108 remained above 70%. This period is the 5th longest since 1986 and ranks in the 97th percentile of all periods of consecutive days above 70%. The subsequent one-month correction laid the groundwork for the next upswing in the rally that has barely taken any time-off for good behavior (this period also printed a false head and shoulders breakdown which led me to believe the bounce from oversold conditions would be weak). Also recall that T2108 accomplished a very rare feat in crossing the 90% level in April. There have only been 7 times that T2108 has crossed above 90% from 1986-2008. All seven of these times were during 1991 and 2003. In 2009, T2108 has crossed above 90% in April and in May. It has come close (89%) several times in August and September.
I am not sure what to make of the lower lows in T2108 since August. Perhaps more stocks are tracking more closely to the 40DMA line. Perhaps each tiny sell-off has gotten deeper for individual stocks. Perhaps there is still time for the significant Fall correction I have been expecting (less and less likely with each passing day and reassuring earnings report).
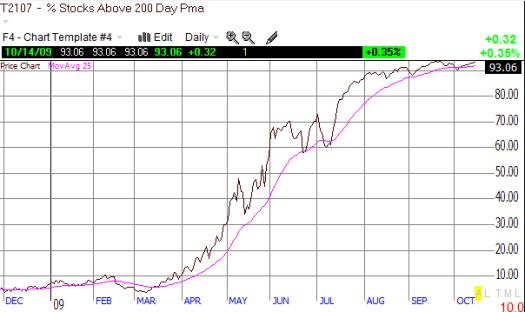
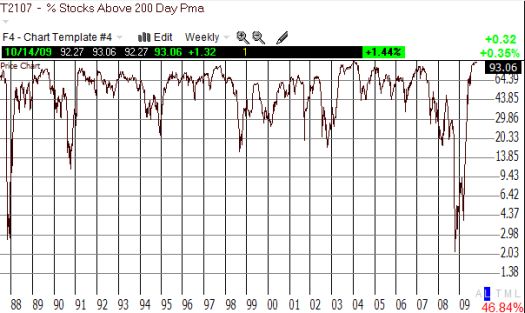
T2107 completes the picture of a strong and sturdy market rally. In April, I noted that T2107 was near a recovery to September, 2008 levels of 25-30%. In hindsight, it turns out that was an excellent early and leading indicator of just how strong the rally would get. Too bad I did not think harder about its potential implications. T2107 has not looked back since and, incredibly, has remained above the 90% level since mid-August.


*All charts created using TeleChart: 
For many months now, T2108 and T2107 have told a consistent story of historic proportions: a strong and well-supported rally locked in an uptrend that remains stubbornly over-bought for very long stretches. The continuation of this rally is certain to lull more and more participants to sleep regarding the deep, structural weaknesses in the economy. Yet, the near-term catalysts for a significant Fall correction are rapidly dwindling. Whenever (if?) we get that deep correction, it should represent the next best buying opportunity since at least July, and maybe March. Until then, all we can do is pick our spots carefully (whether long or short) and very closely manage risk.
Below, stock market veteran Art Cashin leads a muted celebration on the floor of the NYSE for what people are calling Dow 2.0 although we have really had three crossings – 1999, 2003, and now 2009. Cashin remains stupefied by the magnitude of the rally and continues to come up with timely and catchy metaphors to describe it!
Be careful out there!

2 thoughts on “In Honor of Dow 10K v3.0, A Review of T2108 and T2107”