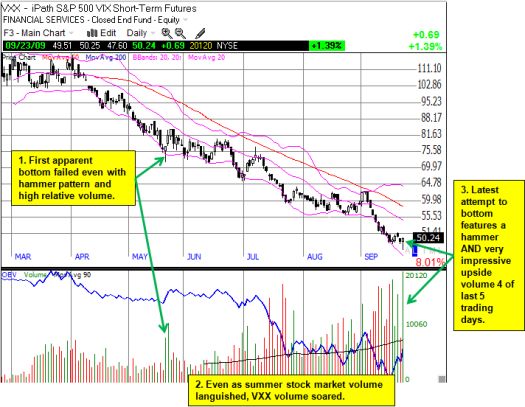
The VXX is an ETF that “offers exposure to a daily rolling long position in the first and second month VIX futures contracts and reflects the implied volatility of the S&P 500 index at various points along the volatility forward curve” (from Yahoo!Finance). This means it offers a method for placing bets on the direction of future volatility in the S&P 500 (click here for an examination of the accuracy of VXX). On Wednesday, in the wake of another Federal Reserve interest rate announcement, the VXX made another attempt to bottom. The chart below shows the first failed bottom in May and how this latest attempted bottom looks much more convincing.

*Chart created using TeleChart:

An increase in volatility going forward implies downward pressure in prices in the stock market. This means the S&P 500 could finally be topping out (for how long, I dare not guess right now). Of course, the stock market’s general uptrend has been so strong for months that it is tempting to ignore yet one more technical indicator that suggests the market “should” top out soon. However, given we are in what is typically a seasonally weak period, and given that the S&P 500 has already surpassed year-end targets from many analysts, I am inclined to keep both eyes open on this one (and, yes, I have been biased for several months in anticipation of significant bearish action sometime this Fall). For another review of the bearish case from a fundamental perspective, check out a very comprehensive interview with Doug Kass. TraderMike reminds us just how rare a down day has become and provides likely support levels that maintain the general uptrend.
I first scaled into the VXX at its August lows and thought I was brilliant as it popped in the middle of August and then again at the beginning of September. As that brilliance wore off for the rest of September, I remained committed to finding one more buying point. I added to the position last week. If I fail to catch the falling knife again, I will likely have to stop out of the position and wait for another opportunity (and/or climb into a basket of speculative calls). I recognize the steep downtrend in the VXX, but if this chart were of any other stock or index, the recent swell in volume would strongly suggest to me that a climactic washout is in process.
Be careful out there!
Full disclosure: long VXX, long SSO puts

Based on the number of True Contrarian subscribers trapped in this thing from mid-60’s down, I would have to say the VIX should explode to about 70 to give this turkey any chance of getting back to the mid-60’s. Pull up a chart comparing VXX and VIX for the last three months and you can see about the only thing the VXX tracks is the Ka-ching of the market makers of this “investment” as they fleece the idiot subscribers and other poor lost souls, that included me until recently (both idiot investor and FORMER subscriber). Thanks for the blog.
http://finance.yahoo.com/echarts?s=VXX#chart5:symbol=vxx;range=3m;compare=^vix;indicator=volume+rsi(7);charttype=line;crosshair=on;ohlcvalues=0;logscale=off;source=undefined
LOL–index tracking gone bonkers.
Hi John,
Investing in these ETFs that use futures is definitely a tough slog. I do not recommend any of them for long-term trades, only shorter-term situational trading.