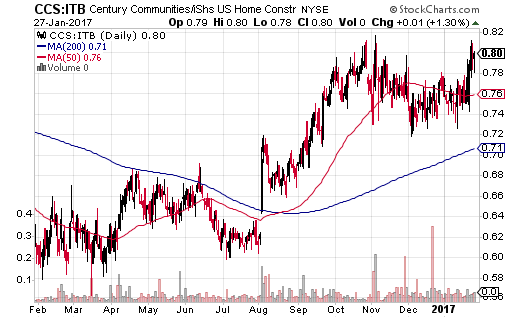
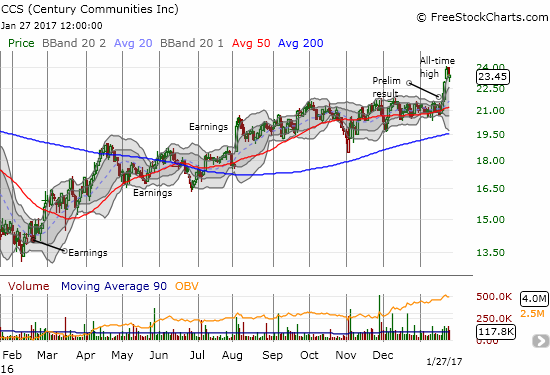
I have long been a fan of Century Communities (CCS) and regional home builders in general. When I took profits in April of 2016 on my accumulated CCS position, I timed the sale to coincide with the end of the seasonally strong period for home builders. CCS was also struggling to break through resistance at its 200-day moving average (DMA). Much to my surprise, CCS broke out 4 months later on strong earnings and began an impressive streak of out-performance versus the iShares US Home Construction (ITB). This streak remains in place.

Source: StockCharts.com
CCS has impressed further by finally hitting all-time highs last week on the heels of preliminary earnings results reported in an SEC filing announcing the offering of Senior Notes.

Source: FreeStockCharts.com (see StockCharts.com to go directly to an interactive chart of CCS)
For 2016, CCS reported (on a preliminary annual basis) an impressive 34.9% increase in home sales revenue on a 17.7% increase in new homes delivered. Net new home contracts increased 21.4% year-over-year, and the backlog increased in value by 11.7%.
Even at new all-time highs, CCS remains relatively cheap. Its price/book ratio is 1.1. Its price/sales ratio is 0.6. The forward P/E for CCS is only 8.2, and its trailing P/E is a quite reasonable 10.5. I am obviously looking back with hindsight wishing I never sold CCS or at least had been prepared to hop back on the bandwagon on this kind of bullish breakout. Instead, I now await the market’s reaction to the earnings report coming February 14th after market. I will be examining margin and earnings per share performance and looking to bullish guidance for 2017.
Here are the specifics from the SEC filing:
“On a preliminary basis, (i) home sales revenues for the year ended December 31, 2016 were approximately $978.7 million, an increase from $725.4 million for the year ended December 31, 2015, (ii) at December 31, 2016, we had total cash, cash equivalents, and cash held in escrow of $49.5 million, compared to total cash, cash equivalents, and cash held in escrow of $41.1 million at December 31, 2015, (iii) at December 31, 2016, we had total debt of $454.1 million, compared to total debt of $390.2 million at December 31, 2015, (iv) during the year ended December 31, 2016, we had approximately 2,825 new homes delivered with an average sales price of approximately $346.5 thousand, compared to 2,401 new homes delivered with an average sales price of approximately $302.1 thousand during the year ended December 31, 2015, (v) net new home contracts (new home contracts net of cancellations) for the year ended December 31, 2016 was approximately 2,860, which increased from 2,356 for the year ended December 31, 2015, and (vi) at December 31, 2016, we had a backlog of approximately 749 sold but unclosed homes with an aggregate sales value of approximately $302.8 million, compared to 714 homes in backlog with an aggregate sales value of approximately $271.1 million at December 31, 2015.”
Be careful out there!
No positions
