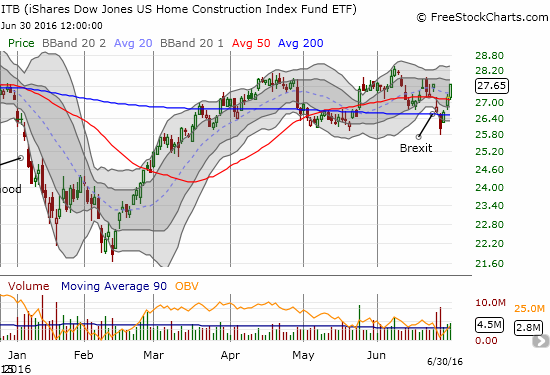
The last Housing Market Review covered data reported in May, 2016 for April. At the time, the iShares US Home Construction ETF (ITB) was experiencing a healthy rebound on the heels of strong data on new home sales. The rally came to a quick halt and had one more small burst in early June. I decided to dip my toe back into the water with some October call options on the iShares US Home Construction (ITB). During the stock market’s brief swoon in the wake of the United Kingdom’s vote to exit the European Union (EU), I did not get a deep enough dip to tease out more purchases.
I cannot shake the feeling that the seasonal trade of home builders is effectively over even if some latent buying interest remains. The net tepid response to the latest round of strong housing data suggests combined with what looks like growing weakness in the West across three of the main metrics I follow seem to confirm that the risk/reward at these levels is tepid. I continue to wait for a larger dip to buy, per my typical strategy for trading the builders.
Source: FreeStockCharts.com
New Residential Construction (Housing Starts) – May, 2016
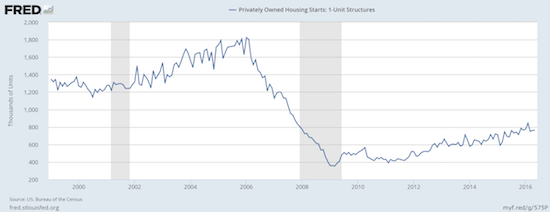
In the last Housing Market Review I expressed relief at an apparent stabilization in housing starts. That stabilization continued in May, consistent with my expectation given strong new home sales in April.
Privately owned housing starts for 1-unit structures came in at 764,000 for May. The April 1-unit starts were revised downward to 762,000 from 778,000. So, the month-over-month change was a gain of 0.3%. The year-over-year growth was a robust 10.1%. The chart below shows the strong uptrend remains in place.
Source: US. Bureau of the Census, Privately Owned Housing Starts: 1-Unit Structures [HOUST1F], retrieved from FRED, Federal Reserve Bank of St. Louis, June 29, 2016.
The West was a big loser for the second month in a row, heightening my on-going wariness about the health of the West’s housing markets. Single unit starts gained 1.9% from April’s big drop, but still lost 4.8% year-over-year. The South registered another double-digit year-over-year gain which was also a 2.6% month-over-month gain. I guess a migration from the West to the South really is happening!?
Existing Home Sales – May, 2016
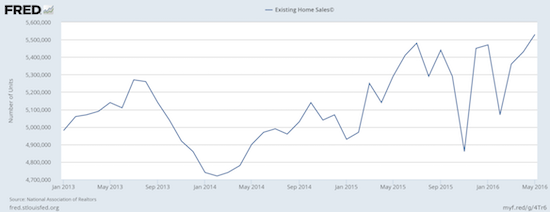
May delivered a second straight month of gains for existing home sales. Sales have not been this high in over 9 years. The National Association of Realtors (NAR) worried as usual about the rising prices resulting from too much demand chasing too little supply:
“Existing inventory remains subdued throughout much of the country and continues to lag even last year’s deficient amount,” adds Yun. “While new home construction has thankfully crept higher so far this year, there’s still a glaring need for even more, to help alleviate the supply pressures that are severely limiting choices and pushing prices out of reach for plenty of prospective first-time buyers.”
With the momentum continuing through the Spring selling season, single-family homes performed well with a 4.5% year-over-year gain. The 5.53M homes sold was 1.8% above April’s pace (April was adjusted downward). The West was the only region in the country to experience a year-over-year drop in exiting home sales. While the West increased 5.4% form April, the region dropped 1.7% year-over-year. The median home price still soared 7.7%. Once again, I see reasons to stay wary about the West’s housing markets.
Source: National Association of Realtors, Existing Home Sales© [EXHOSLUSM495S], retrieved from FRED, Federal Reserve Bank of St. Louis, June 29, 2016.
Although housing inventory increased 1.4% from the prior month, inventory is still down 5.7% from a year ago. Over the last three months, inventory has had greater year-over-year drops. Months of inventory remained flat at 4.7 months of supply. This level remains far short of the 6 months typically indicative of a balanced market. Forty-nine percent (49%) of homes sold in May were on the market for under a month; this level is the highest percentage since tracking began in 2011. As a result, prices continue pushing upward.
May’s 4.7% year-over-year increase in the median price of an existing home represents the 51st consecutive month of year-over-year increases. May’s median price across all housing types of $239,700 sets a new record for existing home sales. This record was last set in June, 2015.
Individual investors bought 13% of existing home sales. This share could be a trough as it stabilizes the recent decline in investor share since February: February 18%, March 14%, and April 13%. This share is still above the 12% trough in August, 2015. Recall that February’s 18% share was the highest since April, 2014.
First-time homebuyers retreated again. Their share of purchases decreased from 32% in April to 30% in May. The average for 2015 was 30%. In the last Housing Market Review I wondered whether first-timer share would increase from the pressure of rising interest rates. Rates since then have instead decreased.
New Residential Sales – May, 2016
April was ALL about the new home sales. This month was all about the anticipation.
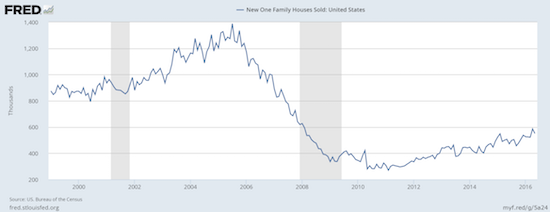
New single-family home sales for May fell 6.0% below April’s level but jumped 8.7% year-over-year. This is a cooling from April’s post-recession high and year-over-year surge. The 551,000 new homes sold maintains the current uptrend that started in 2011. This small cooling is reasonable given the out-sized sales pace from April and could confirm some sales were pulled forward a month (for whatever reason).
Source: US. Bureau of the Census, New One Family Houses Sold: United States [HSN1F], retrieved from FRED, Federal Reserve Bank of St. Louis, June 30, 2016.
New home inventory jumped up to 5.3 from 4.7 months in April. This was a 6.0% gain from May, 2015. Inventory sat at 5.8 months in February and March of 2016. Thus, April looks very much like a bit of an aberration.
May’s new home sales delivered a third strike for the West. The West dropped 8.8% year-over-year and was the one region of the four to decline. In the last Housing Market Review, I suspected the West would deliver its third decline of the last five months. Needless to say, this third strike solidifies my sobering view of the West’s housing markets. The Northeast, the Midwest, and the South registered year-over-year gains of 30.8%, 16.7%, and 13.3% respectively. The Midwest was the one region to register a month-over-month gain (12.9%) in sales.
Home Builder Confidence: The Housing Market Index– June, 2016
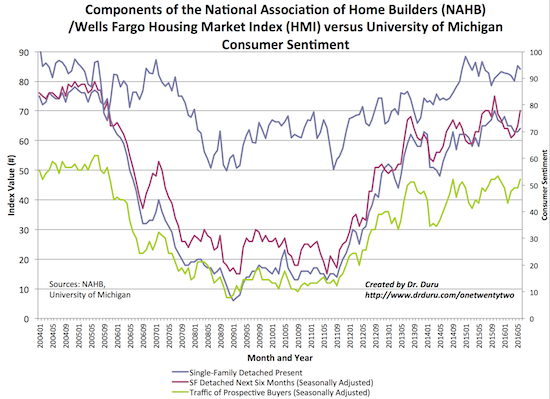
The Housing Market Index (HMI) finally increased after four months staying flat at 58. An HMI of 60 demonstrates a positive response to the strong performance of housing in April and May, but it comes one point short of the high of the year from January. The HMI component measuring future sales expectations diverged even further from the HMI component measuring current sales. I used the downtrend in this latter measure to guess that May’s new home sales would cool down, but I find it surprising that optimism over future sales continues to widen from sentiment on current sales. The chart below shows this is a rare occurrence.
The measure for future sales is at an 8-month high. This measure hit an amazing 10+ year high last October. Builders are definitely holding strong onto optimism. This sentiment bodes well for continuing to buy dips in the shares of home builders.
Source: The National Association of Home Builders (NAHB)
For June, the South led the three-month moving averages for regional HMI with a 2-point gain to 61. The West managed a 1-point gain (despite what I think is a shakier outlook). The Midwest and the Northeast fell 1 and 2 points respectively.
Parting thoughts
The housing data remain strong. Builder sentiment is robust. In the middle of this cheer lurks a housing market in the West that looks a bit wobbly with three strikes against it in this Housing Market Review. With the Spring selling season in the rear view mirror, I cannot imagine what catalysts lie ahead to shore up the West enough to erase my wariness in coming months. KB Home (KBH), with a large dependence on the West, managed to report earnings that the market enjoyed. Post-Brexit, KBH has managed to close at a 10-month high. Perhaps I will find some lingering sparkle for the West in KBH”s report.
I am also left wondering what catalyst sits over the horizon to FINALLY push the iShares US Home Construction (ITB) to a new post-recession high (still 7.5% away). From a trading standpoint, I am dealing with my hesitation by waiting for dips to buy. However, given the quick recovery from Brexit, I am also not sure what catalysts lie ahead to generate a buyable dip.
Add to this cocktail my short-term bearishness on the overall stock market, and I get a recipe for limbo. This state appears strange given the overall momentum in the housing data. My compromise so far is a small investment in call options on ITB that expire in October. This trade is known as a “no regret” position…if ITB manages a rally going forward, I will have a small position to take advantage. If ITB delivers a buyable dip, I will add to my existing position to accumulate the position size I prefer.
Be careful out there!
Full disclosure: long ITB call options
