
(T2108 measures the percentage of stocks trading above their respective 40-day moving averages [DMAs]. It helps to identify extremes in market sentiment that are likely to reverse. To learn more about it, see my T2108 Resource Page. You can follow real-time T2108 commentary on twitter using the #T2108 hashtag. T2108-related trades and other trades are occasionally posted on twitter using the #120trade hashtag. T2107 measures the percentage of stocks trading above their respective 200DMAs)
T2108 Status: 47.9%
T2107 Status: 21.4%
VIX Status: 19.4
General (Short-term) Trading Call: bullish
Active T2108 periods: Day #5 over 20%, Day #4 over 30%, Day #1 over 40% (ending 48 days under 40%) (overperiod), Day #53 below 50%, Day #68 under 60%, Day #409 under 70%
Commentary
we r really close to having confirmed W (or double) bottoms on $SPY $VTI & $DIA . $QQQ & $IWM not far behind https://t.co/5KVKFWZq3b
— Michael Seneadza (@TraderMike) February 23, 2016
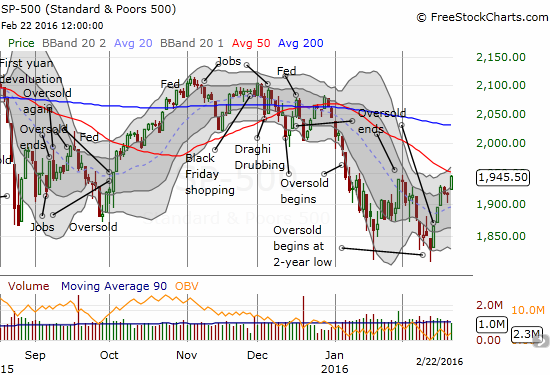
The S&P 500 (SPY) closed with a 1.2% gain and its highest close since January 7, 2016. The index also closed tantalizingly just below resistance at its 50-day moving average. If not for this resistance, I would declare a double-bottom already confirmed.
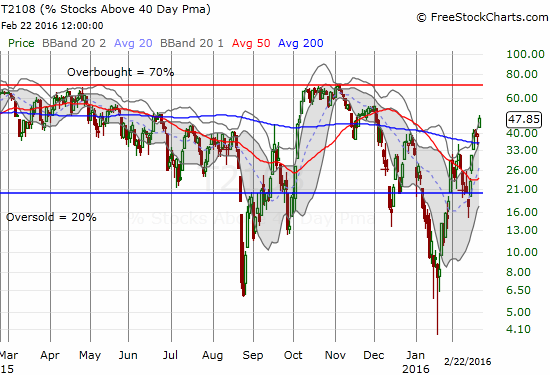
T2108, the percentage of stocks trading above their respective 40DMAs, continues to add to the bullish vibes. My favorite technical indicator closed at 47.9%, its highest close since December 1, 2015. This steady climb combined with a rising S&P 500 represents a broadening rally. This is very healthy and indicates a definitive change in sentiment.
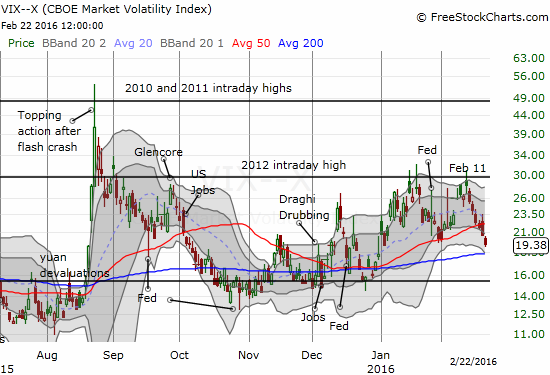
The volatility index, the VIX, acknowledged the change in sentiment by confirming a breakdown below its 50DMA.
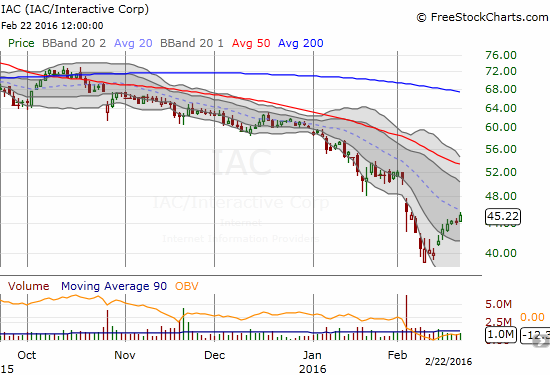
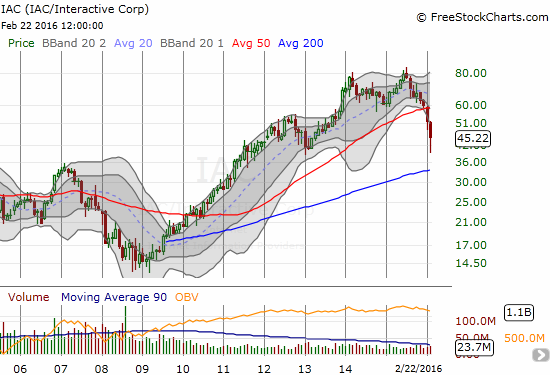
This almost seems too good to be true! Needless to say, I am thinking about hedges again. If the S&P 500 fails to break through 50DMA resistance this week, sellers will surely become bolder. I will actually leave Caterpillar (CAT) alone for now as it has achieved a 50DMA breakout. Instead, I will look for stock specific shorts as hedges. TraderMike (see above) recommended the following chart of IAC/InterActiveCorp (IAC). A close below Monday’s low triggers the short with the assumption that the move will confirm stiff resistance from the downtrending 20DMA. Moreover, the rally to this point has occurred on very weak volume, especially compared to the selling volume that preceded the bottom.
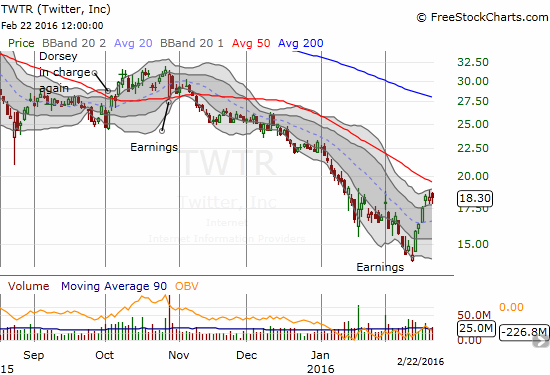
In the last T2108 Update, I showed some some stocks that looked like classic plays to pick coming out of oversold territory. Twitter (TWTR) is a similar stock. While TWTR may seem similar to IAC, I think of it as fundamentally different given the large one-day gains from the lows, the strong buying volume, and now the stock’s ability to penetrate into the upper-Bollinger Bands (BBs) which can ignite an extended rally. TWTR is one 50DMA breakout away from creating a fresh surge higher.
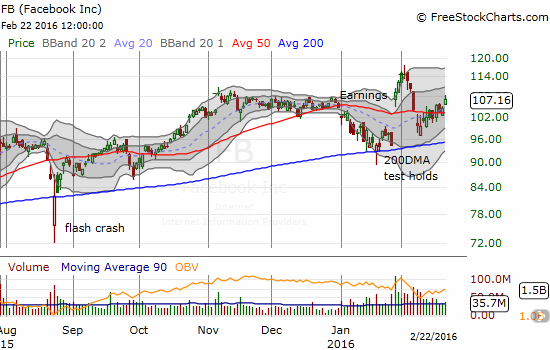
While I am on the topic of internet stocks, I might as well show an update of Facebook (FB). Last week I featured FB in Full Bull (FB) Part Two. Today’s breakaway from 50DMA congestion all but confirmed a new bullish run is underway for FB that will contribute to the growing sentiment change in the market.
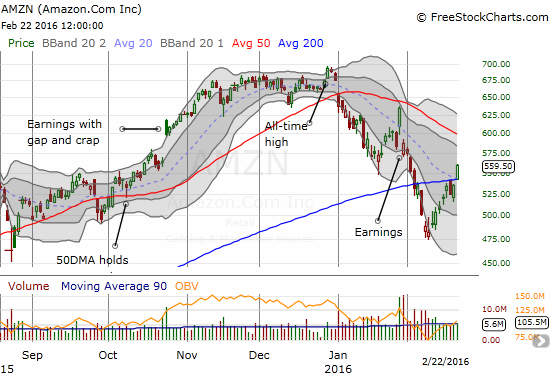
Finally, one more notable move in the internet space…Amazon.com (AMZN) brought together several bullish shifts: a breakout above both its still increasing 200DMA and its downtrending 20DMA. Buying volume has been very strong coming off the February bottom.
It looks like an astute trader could create some very interesting and profitable pairs trades from these collection of internet stocks!
— – —
For readers interested in reviewing my trading rules for T2108, please see my post in the wake of the August Angst, “How To Profit From An EPIC Oversold Period“, and/or review my T2108 Resource Page.
Reference Charts (click for view of last 6 months from Stockcharts.com):
S&P 500 or SPY
U.S. Dollar Index (U.S. dollar)
EEM (iShares MSCI Emerging Markets)
VIX (volatility index)
VXX (iPath S&P 500 VIX Short-Term Futures ETN)
EWG (iShares MSCI Germany Index Fund)
CAT (Caterpillar).
IBB (iShares Nasdaq Biotechnology).
Daily T2108 vs the S&P 500
")
Black line: T2108 (measured on the right); Green line: S&P 500 (for comparative purposes)
Red line: T2108 Overbought (70%); Blue line: T2108 Oversold (20%)
Weekly T2108

*All charts created using freestockcharts.com unless otherwise stated
The charts above are the my LATEST updates independent of the date of this given T2108 post. For my latest T2108 post click here.
Related links:
The T2108 Resource Page
Expanded daily chart of T2108 versus the S&P 500
Expanded weekly chart of T2108
Be careful out there!
Full disclosure: long SSO call options, long SSO shares, long SVXY shares, short TWTR put options, short FB shares and long FB call options,