
(T2108 measures the percentage of stocks trading above their respective 40-day moving averages [DMAs]. It helps to identify extremes in market sentiment that are likely to reverse. To learn more about it, see my T2108 Resource Page. You can follow real-time T2108 commentary on twitter using the #T2108 hashtag. T2108-related trades and other trades are occasionally posted on twitter using the #120trade hashtag. T2107 measures the percentage of stocks trading above their respective 200DMAs)
T2108 Status: 19.7%
T2107 Status: 18.8%
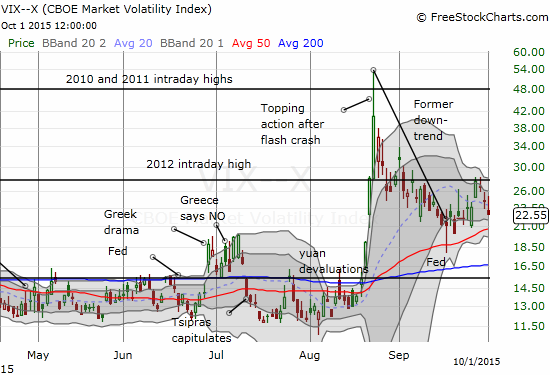
VIX Status: 22.6
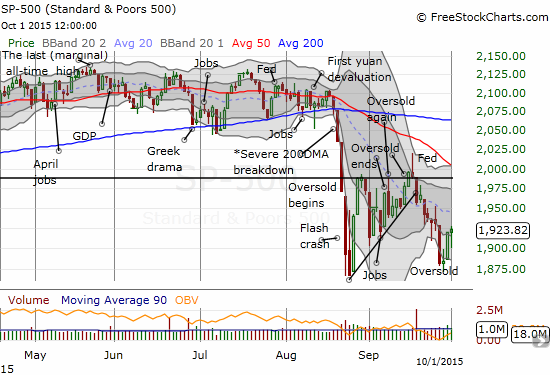
General (Short-term) Trading Call: Bullish (upside target of 1996 on the S&P 500 before overbought conditions finally occur again. See “From the Edge of A Breakout to the Ledge of A Breakdown” for more details).
Active T2108 periods: Day #4 under 20%, Day #10 under 30%, Day #32 under 40%, Day #92 under 50%, Day #109 under 60%, Day #314 under 70%
Reference Charts (click for view of last 6 months from Stockcharts.com):
S&P 500 or SPY
SDS (ProShares UltraShort S&P500)
U.S. Dollar Index (volatility index)
EEM (iShares MSCI Emerging Markets)
VIX (volatility index)
VXX (iPath S&P 500 VIX Short-Term Futures ETN)
EWG (iShares MSCI Germany Index Fund)
CAT (Caterpillar).
IBB (iShares Nasdaq Biotechnology).
Commentary
T2108 is itching to end this oversold period. On the eve of another job report, T2108 closed the day at 19.8% after getting as high as 22.0%. This is the fourth consecutive day of this oversold period. The S&P 500 (SPY) closed with a marginal gain and has ALMOST reversed the big one-day loss that started this week.
Along with the bounce, volatility is sinking once again. The VIX has already reversed all its gains from Monday.
The technicals set up a relatively strong Friday, but the coming U.S. jobs report is likely to dominate the action. If the market interprets the report as good – I have NO feel for whether good news is good or bad at this juncture of rate hike anxiety – the S&P 500 (SPY) should at least finish the reversal of Monday’s loss and COULD surge to a retest of the downtrending 20DMA.
As promised, I have not added to my trades on T2108 oversold conditions. I actually sold my call options on ProShares Ultra S&P500 (SSO) into the previous day’s rally for a nice 50% gain. I am still holding the trading shares on ProShares Short VIX Short-Term Futures (SVXY).
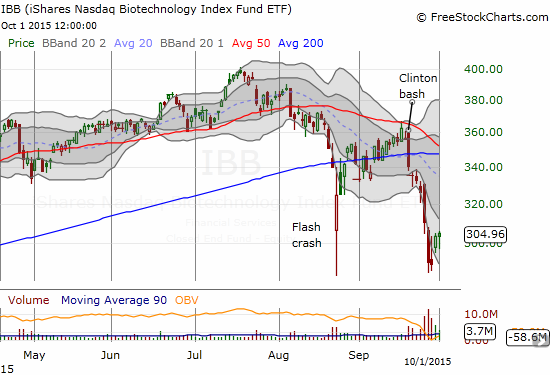
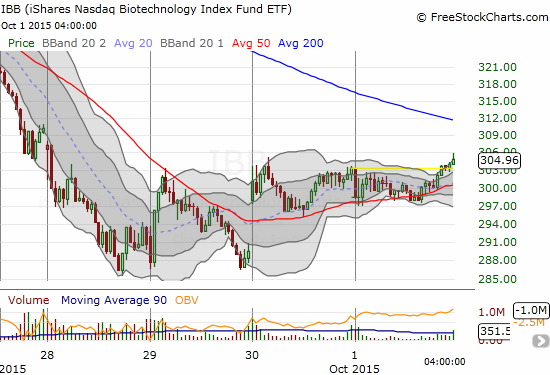
The iShares Nasdaq Biotechnology ETF (IBB) is the more active trade I am following. The situation is quite dynamic. Buyers FINALLY showed up this week for the first time since the “Clinton Bash.” On Tuesday, September 29th, sellers overwhelmed buyers into the close. The next day, buyers showed up in force with a small gap up and closed IBB at the previous day’s high. Today, it was the turn of buyers to reverse early action. All this action continues to happen at higher than average trading volume. If IBB can close out the week at least flat, the massive selling on record volume that brought IBB down to this level will start looking like a classic washout of panicked sellers. I post the daily and 15-minute charts to show the action.
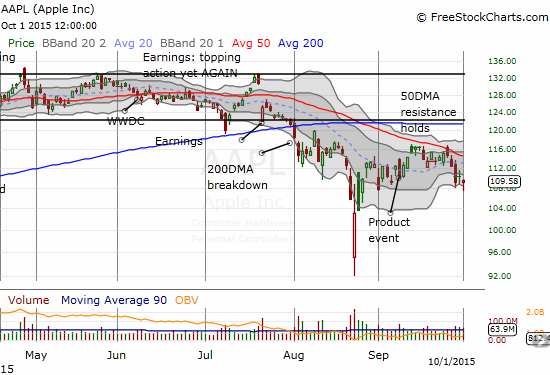
The intraday comeback for Apple (AAPL) took the stock off recent lows. At those lows, it looked like an important follow-through of selling. AAPL continues to work downward off a failed test of resistance at its 50DMA. This downtrend is part of a larger downtrend in place since the important gap down from July earnings. Recall that bad news printed a very rare quadruple top on AAPL. While IBB is a key tell for speculative fervor and risk-taking for the market, AAPL is likely a good tell of general market health. I continue to focus on puts on AAPL as a hedge on my general bullishness. I will continue to do so until this downtrend breaks with a close and follow-through above the 50DMA.
Daily T2108 vs the S&P 500
")
Black line: T2108 (measured on the right); Green line: S&P 500 (for comparative purposes)
Red line: T2108 Overbought (70%); Blue line: T2108 Oversold (20%)
Weekly T2108

*All charts created using freestockcharts.com unless otherwise stated
The charts above are the my LATEST updates independent of the date of this given T2108 post. For my latest T2108 post click here.
Related links:
The T2108 Resource Page
Expanded daily chart of T2108 versus the S&P 500
Expanded weekly chart of T2108
Be careful out there!
Full disclosure: long SVXY shares, long SSO shares, long UVXY put options, long IBB call options, long AAPL put spread and puts