
(T2108 measures the percentage of stocks trading above their respective 40-day moving averages [DMAs]. It helps to identify extremes in market sentiment that are likely to reverse. To learn more about it, see my T2108 Resource Page. You can follow real-time T2108 commentary on twitter using the #T2108 hashtag. T2108-related trades and other trades are posted on twitter using the #120trade hashtag)
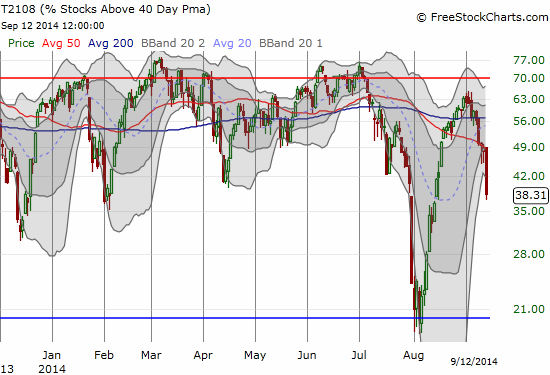
T2108 Status: 38.3%
VIX Status: 13.3%
General (Short-term) Trading Call: Hold (Aggressive traders can short with tight stops)
Active T2108 periods: Day #308 over 20% (includes day #280 at 20.01%), Day #24 over 30%, Day #1 under 40% (underperiod), Day #4 under 50%, Day #7 under 60%, Day #48 under 70%
Reference Charts (click for view of last 6 months from Stockcharts.com):
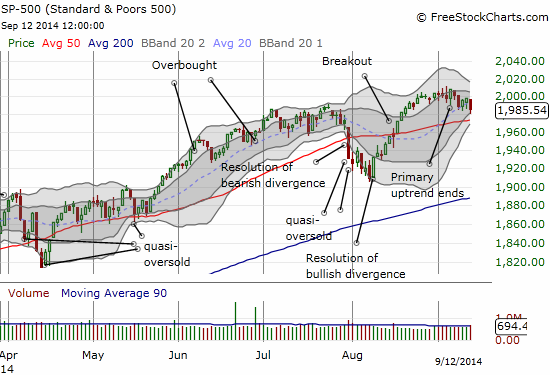
S&P 500 or SPY
SDS (ProShares UltraShort S&P500)
U.S. Dollar Index (volatility index)
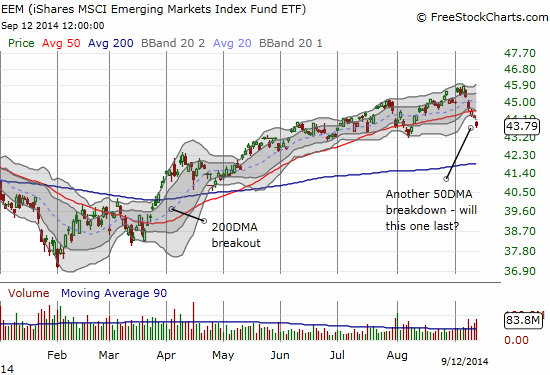
EEM (iShares MSCI Emerging Markets)
VIX (volatility index)
VXX (iPath S&P 500 VIX Short-Term Futures ETN)
EWG (iShares MSCI Germany Index Fund)
CAT (Caterpillar).
Commentary
On July 30th, I pointed out a “quiet” divergence between a plunging T2108 and a relatively calm S&P 500 (SPY). The next day, the S&P 500 took the plunge to the tune of a 2% loss. On Friday, September 12 another quiet divergence occurred.
Just like the last quiet diverge, T2108 has been steadily dropping while the S&P 500 has managed to trade relatively flat. This time around the divergence is particularly wide…and thus even more concerning. T2108 dropped from 49% on Thursday to 38%. Another big drop on Monday, and the market will hit quasi-oversold conditions! Under 40% with this kind of speed also has me wondering about an imminent visit toward true oversold conditions (below 20%).
While we wait for the resolution of the quiet divergence and then the Fed meeting, here are some interesting stock charts to study…
iShares MSCI Emerging Markets (EEM)
EEM was my great trade of the week. I mentioned the setup in the last T2108 Update. I almost got a double on the put options. I sold because I did not see any follow-through after the first 30 minutes of selling. With expiration coming up next Friday (September 19th), I thought it made sense to lock in the profits now before time, and perhaps the Fed, erode the value of the puts. These profits easily paid for the calls I bought for a hedge as well as leave me with a tidy net profit. So, if EEM retains its uptrend, I have some time to make money on both sides of the trade while letting the house pay for the bullish side. However, I think EEM’s slide – led by its Brazilian component – confirmed the flag is waving a bright red color.
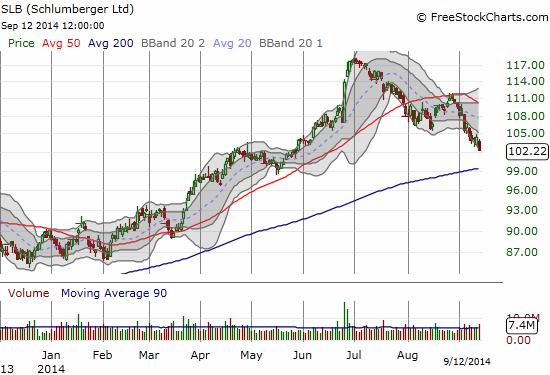
The oil complex is falling fast. Oil-related plays were the darling of 2014. They are quickly turning into goats. SLB has gone from about a 28% gain for the first half of 2014 to a complete reversal of the large surge on June 25th, to a failed retest of its 50DMA as resistance, to what now seems a near certain retest of 200DMA as support. I have this one on my active radar now!
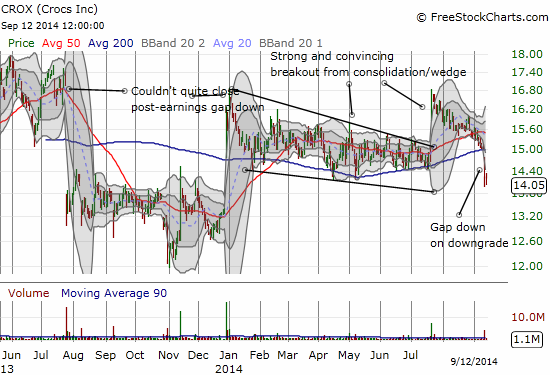
CROX has quickly gone from bullish promise to bearish disappointment. The essential confirmation came last Thursday when a single analyst downgrade to neutral seemed sufficient to send the stock gapping down below 200DMA support. This move confirms a complete wipe-out of July’s large earnings surge (which I used to unload my last CROX) position) and the likely continuation of the downtrend in place since the large gap up on December 30th. Given THAT move failed to erase an earnings gap down from July, 2013, CROX should likely be treated like a broken stock.
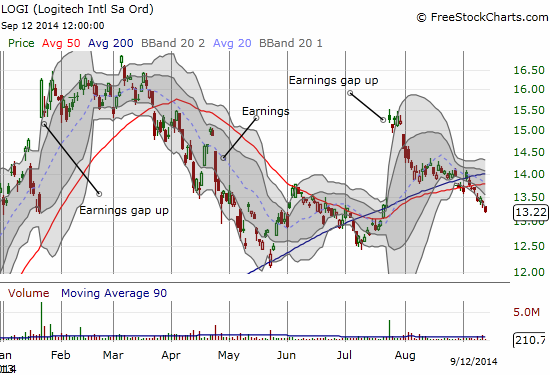
LOGI is having its own problems maintaining altitude through earnings announcements. The chart below does not show the year-to-date flat performance for LOGI that follows anincredible ramp up from 2013: from $7 to $17 from July, 2013 to March, 2014. The chart says it all in terms of fading momentum relative to earnings.
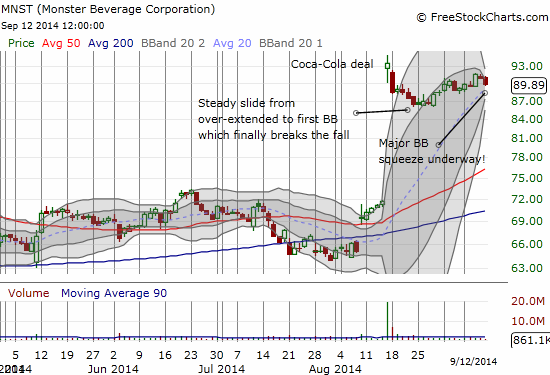
Finally, MNST is facing a tremendous Bollinger Band (BB) squeeze. This one is already on my radar since I am already trying to play a return to upward momentum post-deal with Coke. I am still waiting…
")
Black line: T2108 (measured on the right); Green line: S&P 500 (for comparative purposes)
Red line: T2108 Overbought (70%); Blue line: T2108 Oversold (20%)
Weekly T2108

*All charts created using freestockcharts.com unless otherwise stated
The T2108 Resource Page
Expanded daily chart of T2108 versus the S&P 500
Expanded weekly chart of T2108
Be careful out there!
Full disclosure: long put and call options on EEM, net short Australian dollar, long USD/TRY