
(T2108 measures the percentage of stocks trading above their respective 40-day moving averages [DMAs]. It helps to identify extremes in market sentiment that are likely to reverse. To learn more about it, see my T2108 Resource Page. You can follow real-time T2108 commentary on twitter using the #T2108 hashtag. T2108-related trades and other trades are posted on twitter using the #120trade hashtag)
T2108 Status: 68.5%
VIX Status: 12.3
General (Short-term) Trading Call: Short (bearish bias).
Active T2108 periods: Day #134 over 20%, Day #9 over 60% (overperiod), Day #49 under 70%
Reference Charts (click for view of last 6 months from Stockcharts.com):
S&P 500 or SPY
SDS (ProShares UltraShort S&P500)
U.S. Dollar Index (volatility index)
EEM (iShares MSCI Emerging Markets)
VIX (volatility index)
VXX (iPath S&P 500 VIX Short-Term Futures ETN)
EWG (iShares MSCI Germany Index Fund)
CAT (Caterpillar).
Commentary
Whiplash Part 2.
It appears, once again, the sellers simply do not have the firepower to sustain much, if any, follow through. Today, the S&P 500 (SPY) continued yesterday’s comeback with a 0.5% gain that puts the index a hair above the bear/bull zone.
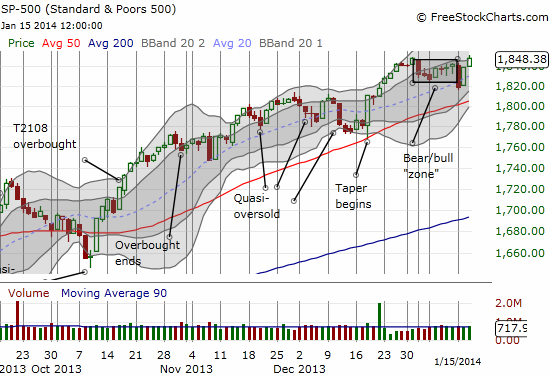
Despite the extension of the buying, I went ahead and bought a second tranche of ProShares Ultra S&P500 (SSO) puts. I am following my rules on this one, but I am not optimistic. I am fully prepared to put the SSO puts behind me as hedging for playing an extended overbought rally. T2108 is almost exactly where it was on Friday when I was preparing for overbought conditions. The big caveat to bullish expectations here is that the volatility index, the VIX, is already extremely low. Whenever any coming rally ends, it will likely end with a bang!
In the last T1208 Update I noted that I see whiplash in a bunch of key trades and that traders need to be ready to seize opportunity in a hurry. I have three live examples today, two of which I was able to trade. I provide these examples to demonstrate how I try to think through the split-second decisions and also to demonstrate how easy it is to miss an opportunity that in hindsight appears obvious.
First, (what else?) Apple (AAPL). Going into today, AAPL had high odds of upside (as noted in the last T2108 Update). At the open, AAPL gapped up and ripped higher. See this 5-minute chart…
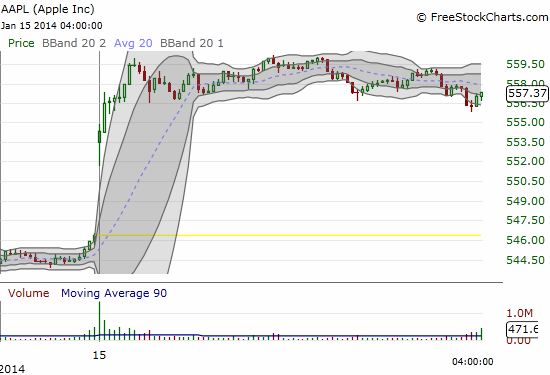
I have seen this behavior countless times. If I do not make up my mind within the first 5 minutes or so, the trade is over because the risk/reward is not good enough. With the Apple Trading Model (ATM) backing me up, I quickly bought weekly $565 calls (1/17/14: corrected from $465 calls – hat tip to reader who alerted me!). By the time the clock reached the critical end of the first 30 minutes of trading, my calls had almost doubled. I decided that was good enough and put the calls out to pasture. This move happened to turn out fine: the subsequent slow-motion drift would have driven me crazy. For good measure, I bought a put in prep for what could/should be a downside Friday. In the way though is another ATM prediction of upside for Thursday trading. The 73% odds come with a big stability caveat: if AAPL had closed just a few tenths of a percent higher or lower, the ATM would have produced strong odds of downside.
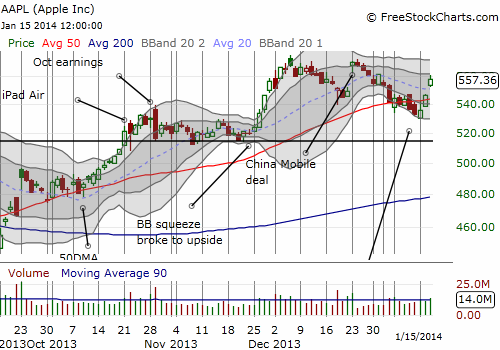
The daily chart shows that AAPL has broken free of the sloppy 50DMA retest and is now, as I like to say, running in the open field. Looks like I will be dead wrong about AAPL retesting the $514 level before earnings!
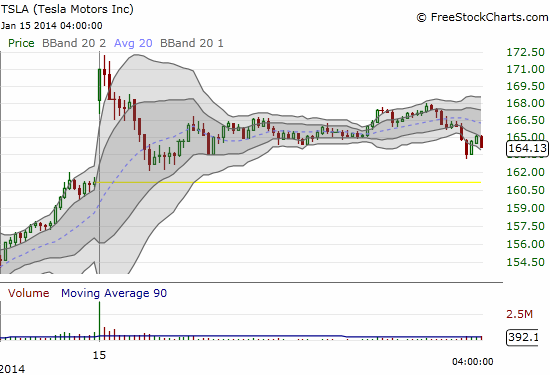
Next up is Tesla Motors (TSLA). This is a play I missed yesterday AND today. This time though the odds were tipped against TSLA. The stock gapped up far above its upper-Bollinger Band (BB), ripe for shorting. Moreover, even the 5-minute chart shows clearly that the open was over-extended. And 5 minutes is about the time I would have had to make up my mind if I had been paying closer attention. Doing this chart review, the opportunity looks obvious in hindsight!
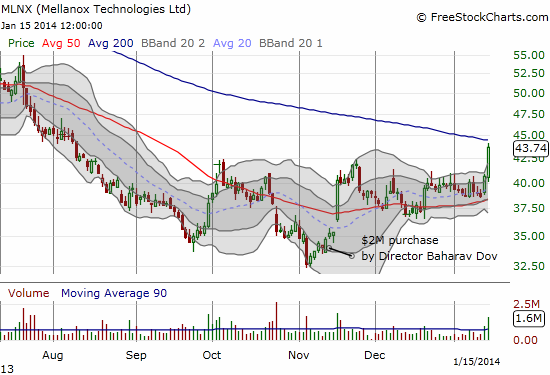
Finally, I have a new entrant, Mellanox Technologies (MLNX). This is an example where I simply do not have the time to flag every opportunity I see in a timely fashion. MLNX is a stock that fell of my radar until on Tuesday I stumbled upon the news of an initiation by Macquarie to Outperform. The market responded with strong buying volume. Even MORE interesting is that the daily chart reminded me of Intuitive Surgical (ISRG). Given the huge success I had with ISRG this week, you can imagine how I snapped to attention. Later last night I discovered that a MLNX insider loaded up $2M worth of stock. That was the last pin to fall for me, and I resolved to get in at the next opportunity. Near the open, I noticed MLNX was down ever so slightly. Not wanting to wait, I put on half a position with the full intent to buy the other half in the event of a bigger pullback in coming days. Instead, out of nowhere, MLNX soared, fell backwards sharply, and then soared again. It is now just below its 200DMA in another eerie similarity to ISRG’s attempted break from consolidation this week. Stay tuned on this one!
Way back in the day when I daytraded, my mentor schooled me on waiting out the first 30 minutes of the trading day, sometimes the whole first hour. His valid concern was that a lot of trickery happens at the open that gets reversed over the course of the trading day. For example, too many retail investors would leave trades to execute at the market at the open because they worried about missing a trade while at or getting to work. These trades are easy pickings for market makers. However, what I see these days is that often times the entire move on the best opportunities is over and done in the first hour or so of trading. I suspect this is a function of high-frequency traders all rushing into the same idea at once. I am still adjusting my thinking in this new, brave world.
Daily T2108 vs the S&P 500
")
Black line: T2108 (measured on the right); Green line: S&P 500 (for comparative purposes)
Red line: T2108 Overbought (70%); Blue line: T2108 Oversold (20%)
Weekly T2108

*All charts created using freestockcharts.com unless otherwise stated
Related links:
The T2108 Resource Page
Expanded daily chart of T2108 versus the S&P 500
Expanded weekly chart of T2108
Be careful out there!
Full disclosure: long SPHB and SPLV and SSO puts (pairs trade), long AAPL shares and puts, long MLNX